Fig. 4
Download original image
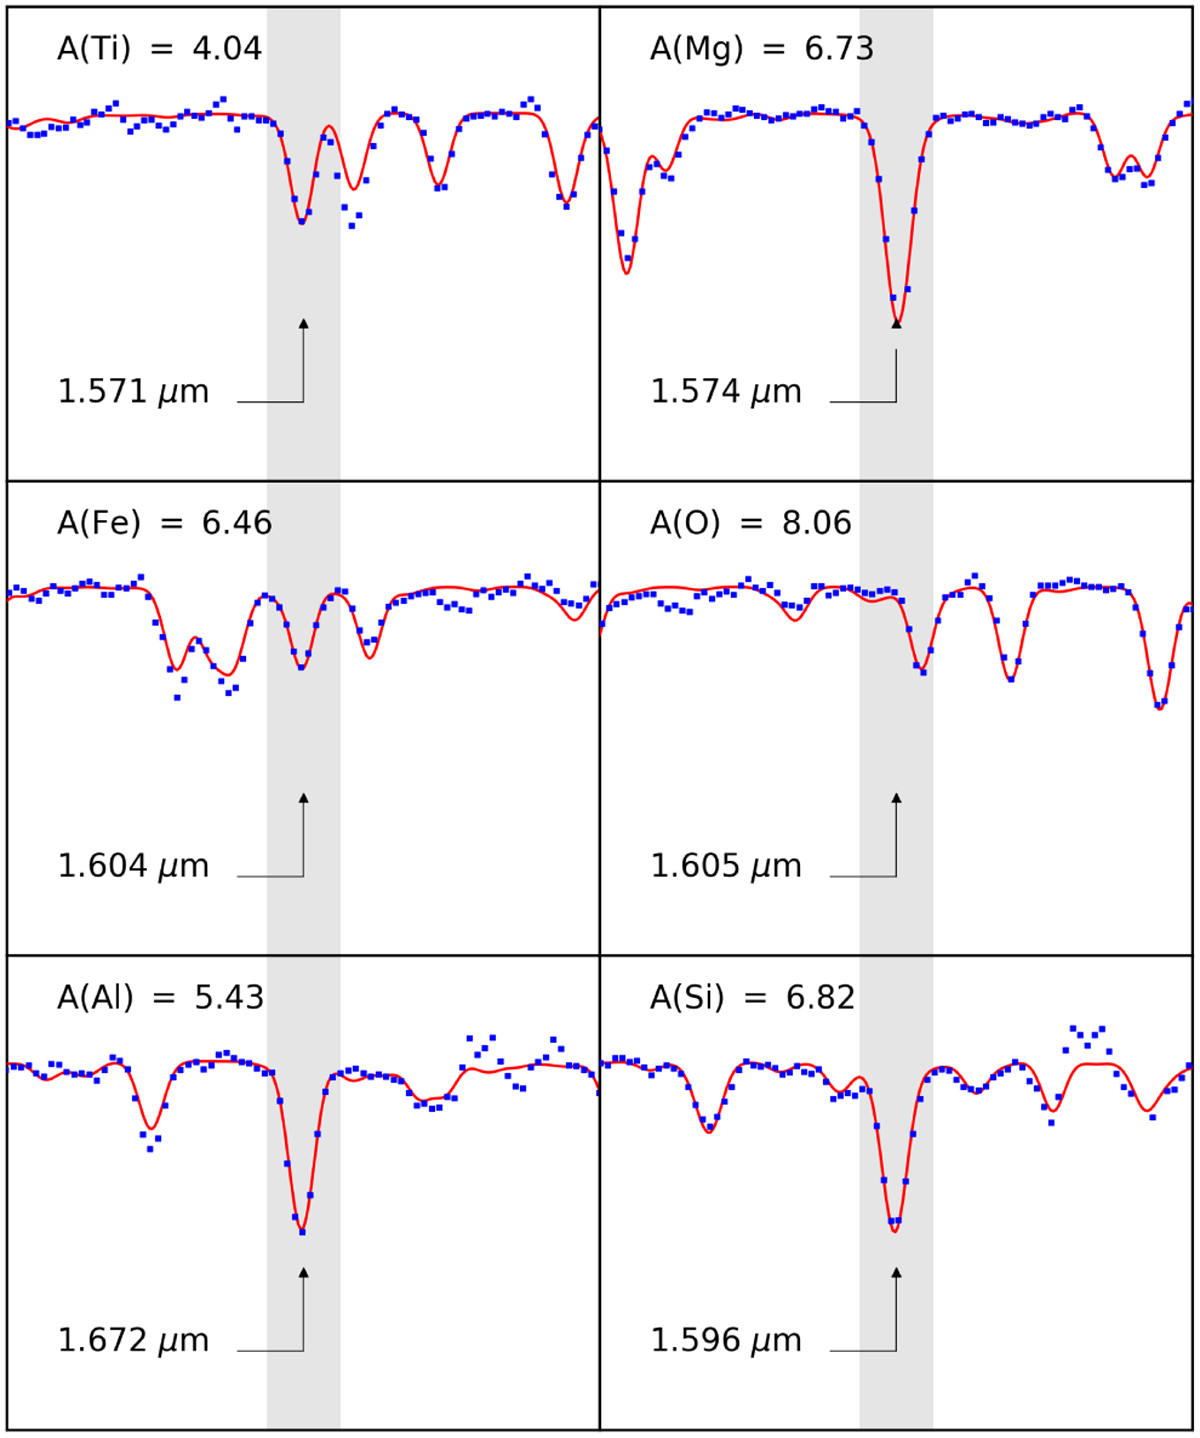
Comparison of synthetic spectra (red lines) to the observed spectra (blue dots) for the HP 1 star 2M17310541–2958416. Each panel show the best-determined (gray shadow region) [Ti/Fe], [Mg/Fe], [Fe/H], [O/Fe], [Al/Fe], and [Si/Fe] abundance ratios listed in Table 3. An arbitrary normalized flux is plotted on the vertical axis, while the air wavelength (μm) is plotted on the horizontal axis.
Current usage metrics show cumulative count of Article Views (full-text article views including HTML views, PDF and ePub downloads, according to the available data) and Abstracts Views on Vision4Press platform.
Data correspond to usage on the plateform after 2015. The current usage metrics is available 48-96 hours after online publication and is updated daily on week days.
Initial download of the metrics may take a while.