Fig. 2
Download original image
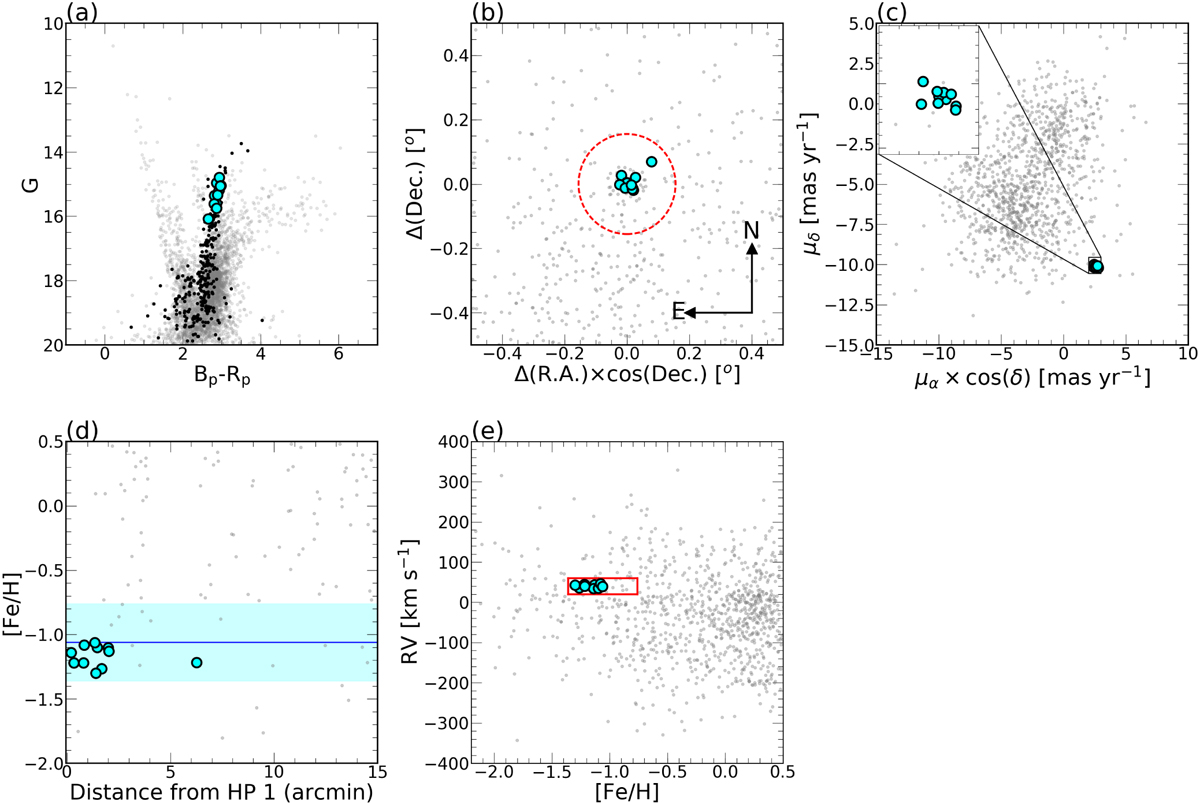
Main properties of HP 1 stars. Panel (a: color–magnitude diagram in the Gaia bands for cluster stars with a membership probability greater than 90% (black dots) and <90% (gray dots), taken from Vasiliev & Baumgardt (2021). The 11 stars analyzed in this work are marked with cyan symbols in all the panels. The APOGEE-2 footprint stars toward HP 1 are marked with gray dots in panels b, c, d, and e. Panel b: sky position of stars centered on HP 1; the large overlaid dashed red circle refers to the cluster tidal radius (rt). Panel c: PM distribution for stars toward the field of HP 1, with the inner zoomed window highlighting the distribution of our sample within a 0.5 mas yr−1 radius around the nominal PM of the cluster. Panel d: [Fe/H] versus the projected angular cluster distance, with the blue line showing the assumed initial mean cluster metallicity and the cyan shadow region indicating ±0.3 dex from the initial metallicity. Panel e: Radial velocity versus [Fe/H] of our member stars compared to APOGEE-2 field stars. The red box delimited by ±0.30 dex and ±20 km s−1, centered on [Fe/H] = −1.06 and RV = +39.76 km s−1, encloses our potential cluster members (see Sect. 2). The metallicity values shown in panels d and e were taken from the ASPCAP pipeline.
Current usage metrics show cumulative count of Article Views (full-text article views including HTML views, PDF and ePub downloads, according to the available data) and Abstracts Views on Vision4Press platform.
Data correspond to usage on the plateform after 2015. The current usage metrics is available 48-96 hours after online publication and is updated daily on week days.
Initial download of the metrics may take a while.