Open Access
Fig. 7
Download original image
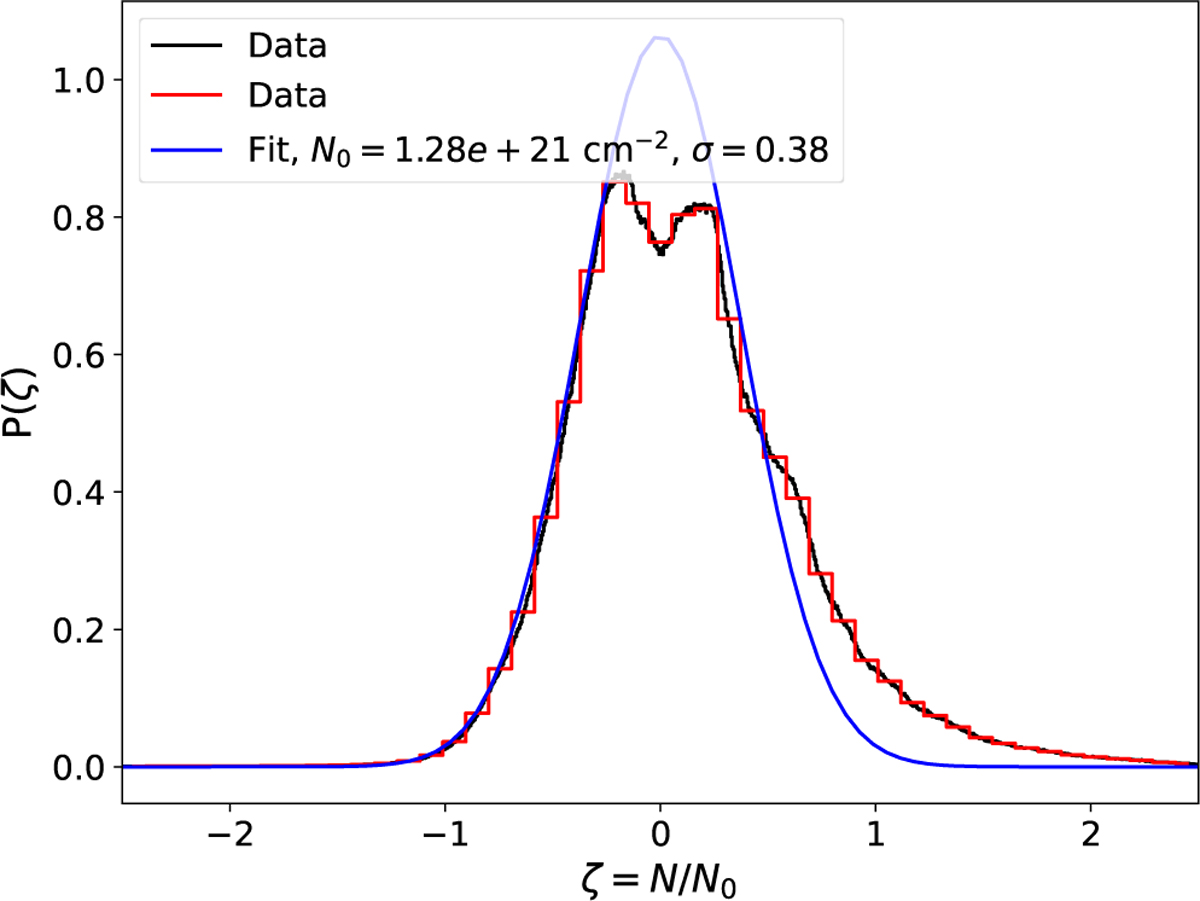
N-PDF for the Taurus cloud with the best fit log-normal distribution. The black and red lines show the histograms of the data, where the black uses an automated procedure for binning and the red uses a fixed bins more typical to previous studies. The blue line shows the lognormal utilized in this work.
Current usage metrics show cumulative count of Article Views (full-text article views including HTML views, PDF and ePub downloads, according to the available data) and Abstracts Views on Vision4Press platform.
Data correspond to usage on the plateform after 2015. The current usage metrics is available 48-96 hours after online publication and is updated daily on week days.
Initial download of the metrics may take a while.