Fig. 7.
Download original image
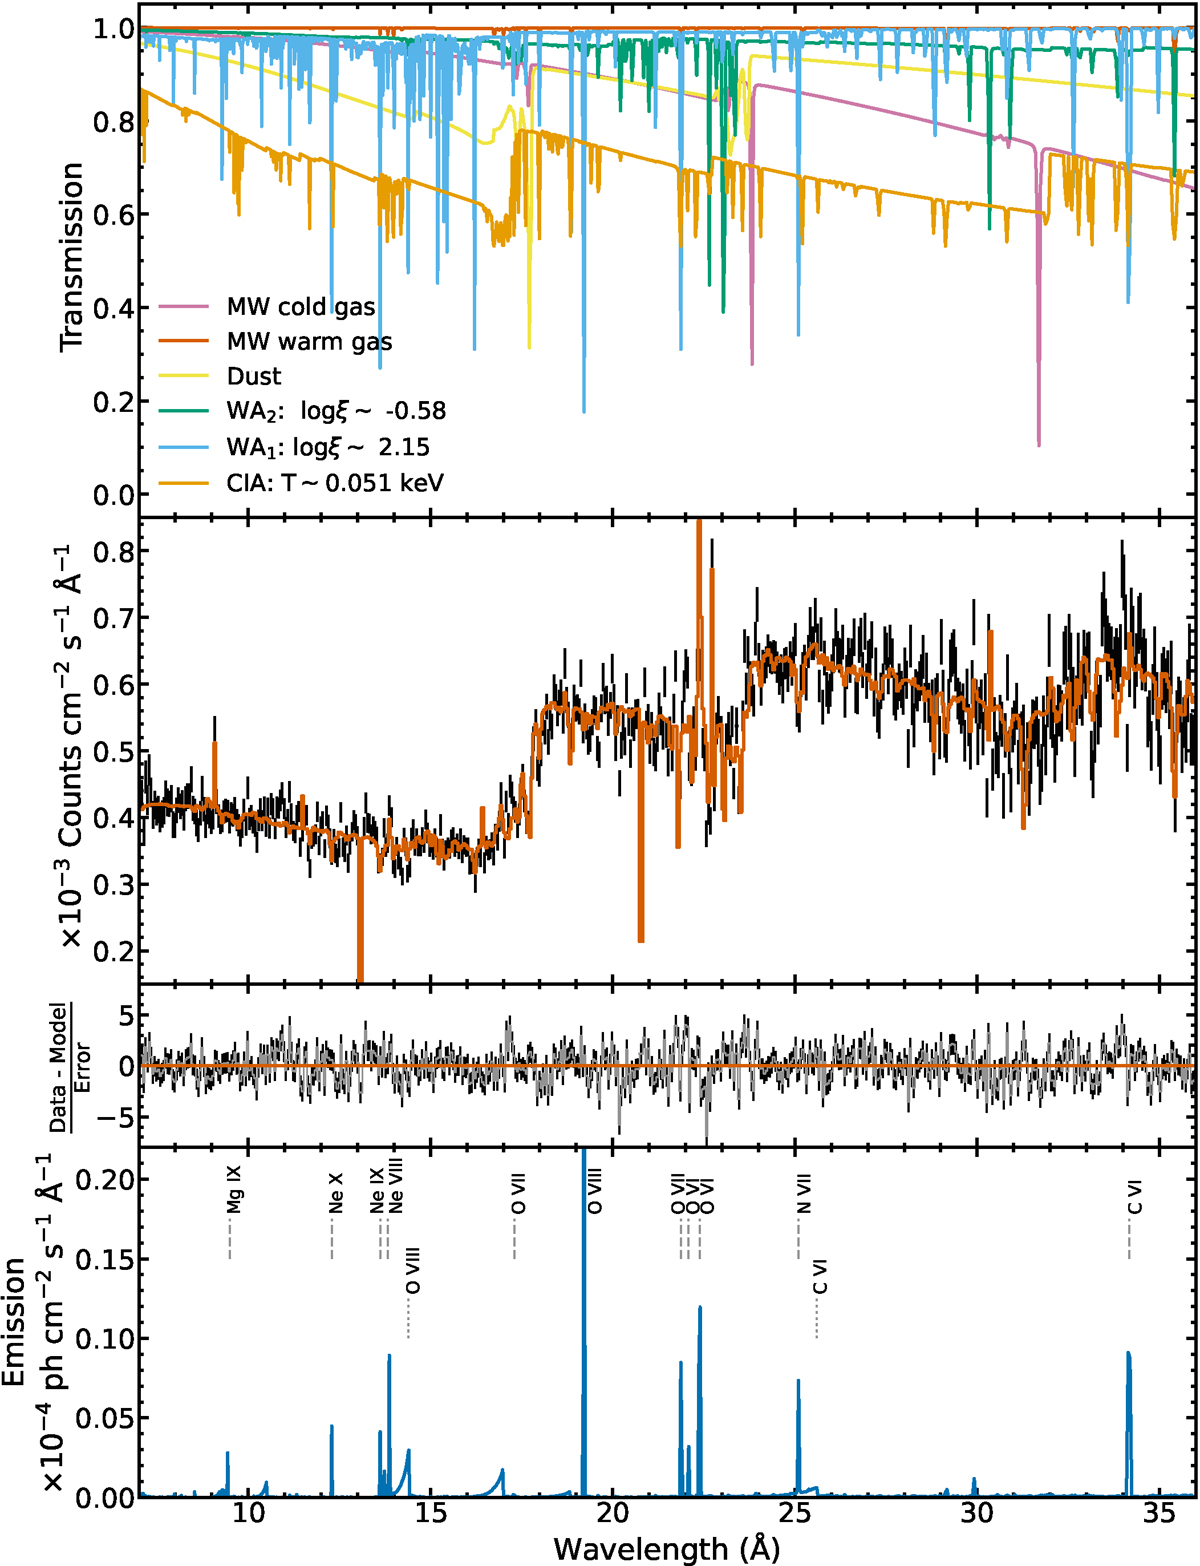
Best fit model for the RGS data. Upper panel: Transmission plot. Transmission is defined as the observed spectrum divided by the continuum. The different absorbing components are explained in the legend. Middle upper panel: RGS data (black) with the best-fit model (red). Middle lower panel: Residuals from our best-fit model. Lower panel: Emission features predicted by PION in emission. The most prominent features are labelled.
Current usage metrics show cumulative count of Article Views (full-text article views including HTML views, PDF and ePub downloads, according to the available data) and Abstracts Views on Vision4Press platform.
Data correspond to usage on the plateform after 2015. The current usage metrics is available 48-96 hours after online publication and is updated daily on week days.
Initial download of the metrics may take a while.