Fig. 6.
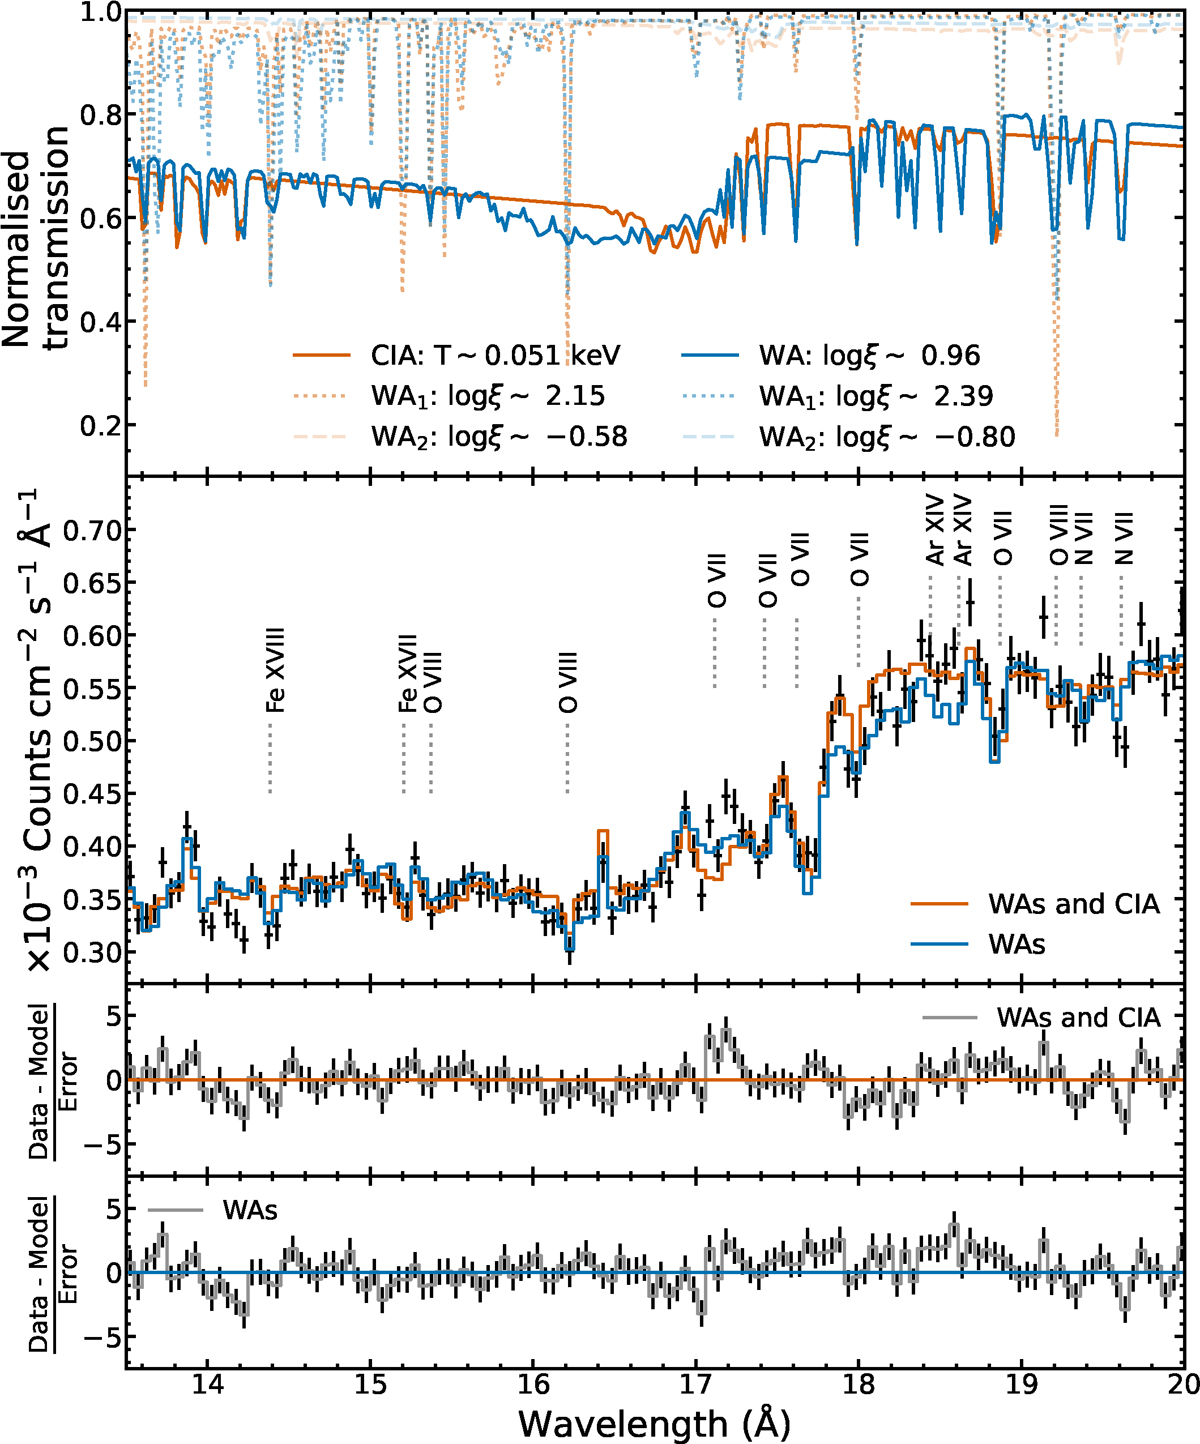
Download original image
Comparison between a model using a combination of WAs and CIA as opposed to WAs alone. Upper panel: Transmission plot. Transmission is defined as the observed spectrum divided by the continuum. This plot compares the behaviour of the CIA (red) around the 13 − 20 Å region in comparison to a WA with log ξ ∼ 0.96 (blue). The transmissions obtained by the other WAs used in both models are shown in fainter red and blue. Upper middle panel: Difference between a model implementing WAs and CIA (red) as opposed to WAs alone (blue). “WAs and CIA” is used to indicate our best-fit model. “WAs” is meant to represent the model with three WAs and no CIA. It is apparent that the latter case creates additional absorption in the 17 − 18 Å region. The most prominent absorption features identified by our models are marked and labelled. Lower middle panel: Residuals of the CIA and WA model. Lower panel: Residuals of the WAs model.
Current usage metrics show cumulative count of Article Views (full-text article views including HTML views, PDF and ePub downloads, according to the available data) and Abstracts Views on Vision4Press platform.
Data correspond to usage on the plateform after 2015. The current usage metrics is available 48-96 hours after online publication and is updated daily on week days.
Initial download of the metrics may take a while.