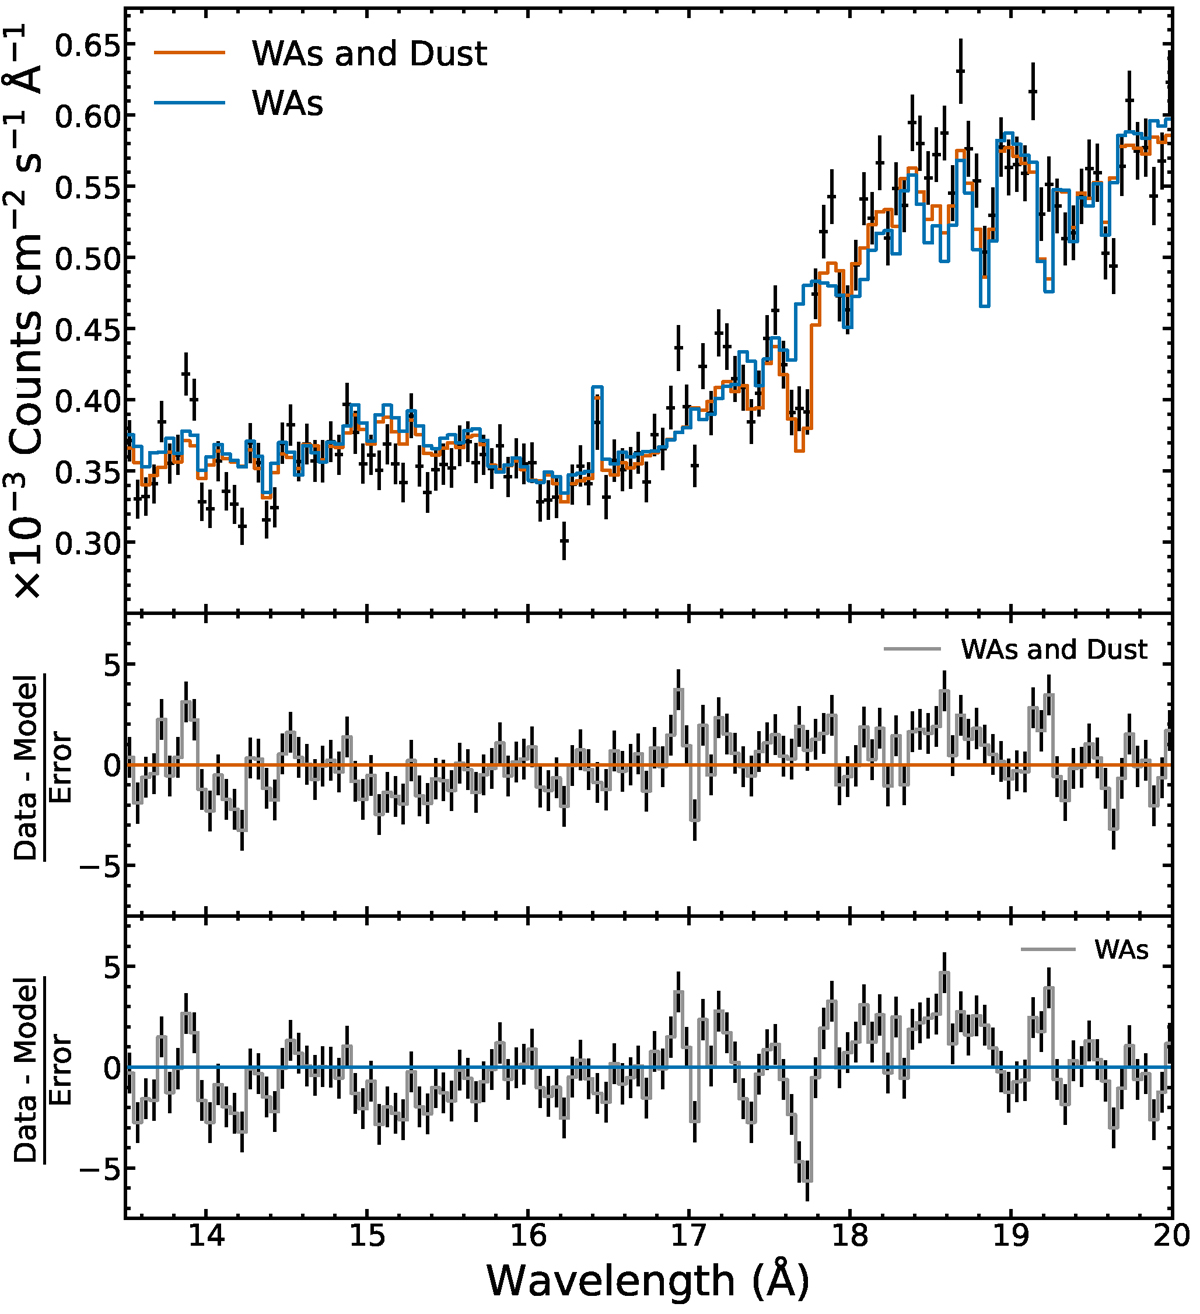
Fig. 5.
Download original image
Comparison between a model using a combination of three WAs and dust as opposed to WAs alone. Upper panel: Model implementing three WAs and dust (red) vs. WAs alone (blue). The latter case does not take into account the additional absorption in the 15 − 18 Å region, while the WAs and dust model does. The RGS data are shown in black. Middle panel: Residuals of the WA and dust model. Lower panel: Residuals of the WA model.
Current usage metrics show cumulative count of Article Views (full-text article views including HTML views, PDF and ePub downloads, according to the available data) and Abstracts Views on Vision4Press platform.
Data correspond to usage on the plateform after 2015. The current usage metrics is available 48-96 hours after online publication and is updated daily on week days.
Initial download of the metrics may take a while.