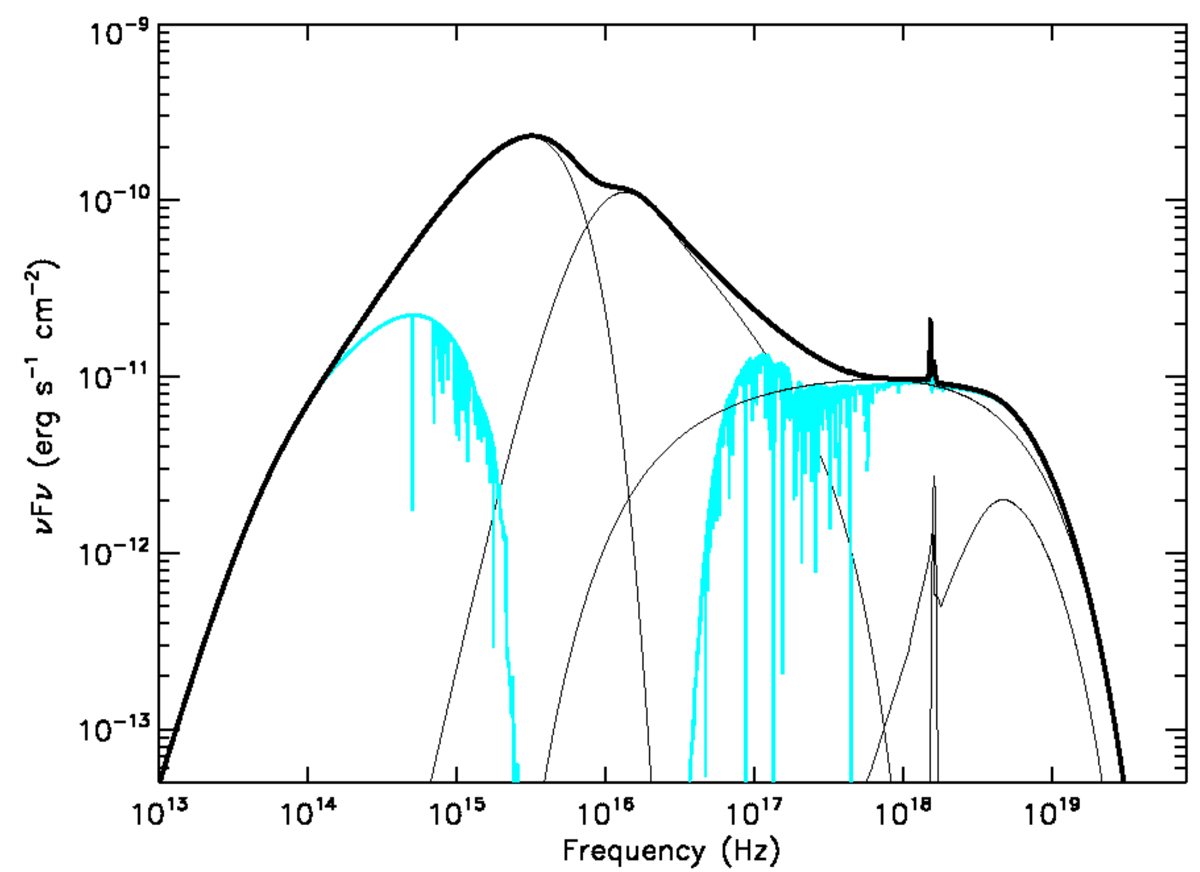
Fig. 3.
Download original image
Model obtained from the SED fitting of the XMM-Newton EPIC-pn and OM merged observations. We show the best-fit model to the data in black. The curves in grey show the emission components that make up the model, which are from left to right DBB, COMT, POW, REFL, and GAUSS. The model of the absorbed spectrum is plotted in blue.
Current usage metrics show cumulative count of Article Views (full-text article views including HTML views, PDF and ePub downloads, according to the available data) and Abstracts Views on Vision4Press platform.
Data correspond to usage on the plateform after 2015. The current usage metrics is available 48-96 hours after online publication and is updated daily on week days.
Initial download of the metrics may take a while.