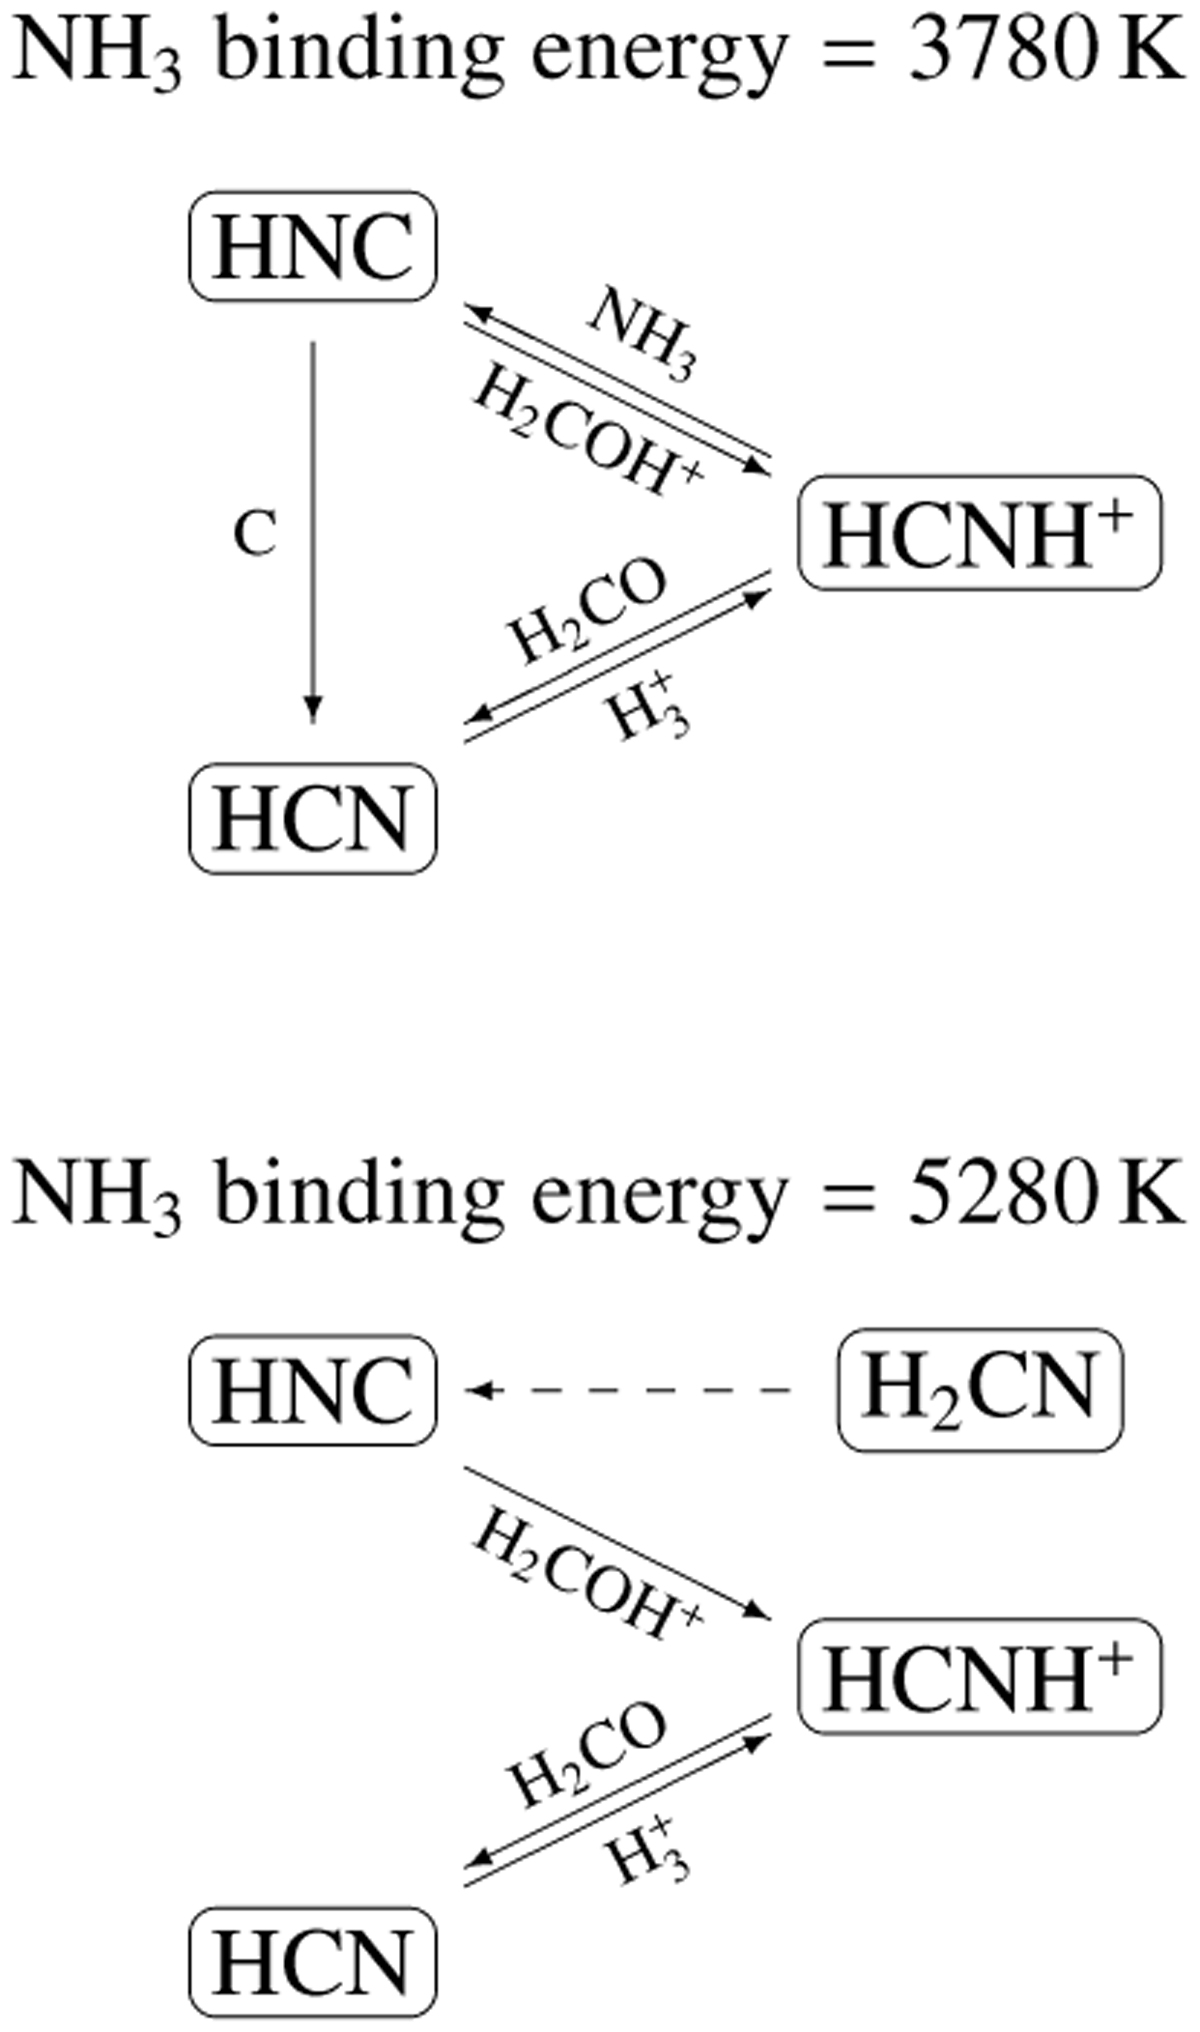
Fig. 6
Download original image
Main formation and destruction pathways of HNC as predicted by the chemical model for the two extreme binding energy (BE) values. In the lower figure (BE = 5280 K), the dashed arrow represents an alternative pathway for the formation of HNC through H-abstraction from H2CN. This pathway becomes prominent when the gas-phase abundance of NH3 is low, thereby inhibiting the formation via the reaction between NH3 and HCNH+.
Current usage metrics show cumulative count of Article Views (full-text article views including HTML views, PDF and ePub downloads, according to the available data) and Abstracts Views on Vision4Press platform.
Data correspond to usage on the plateform after 2015. The current usage metrics is available 48-96 hours after online publication and is updated daily on week days.
Initial download of the metrics may take a while.