Fig. 9
Download original image
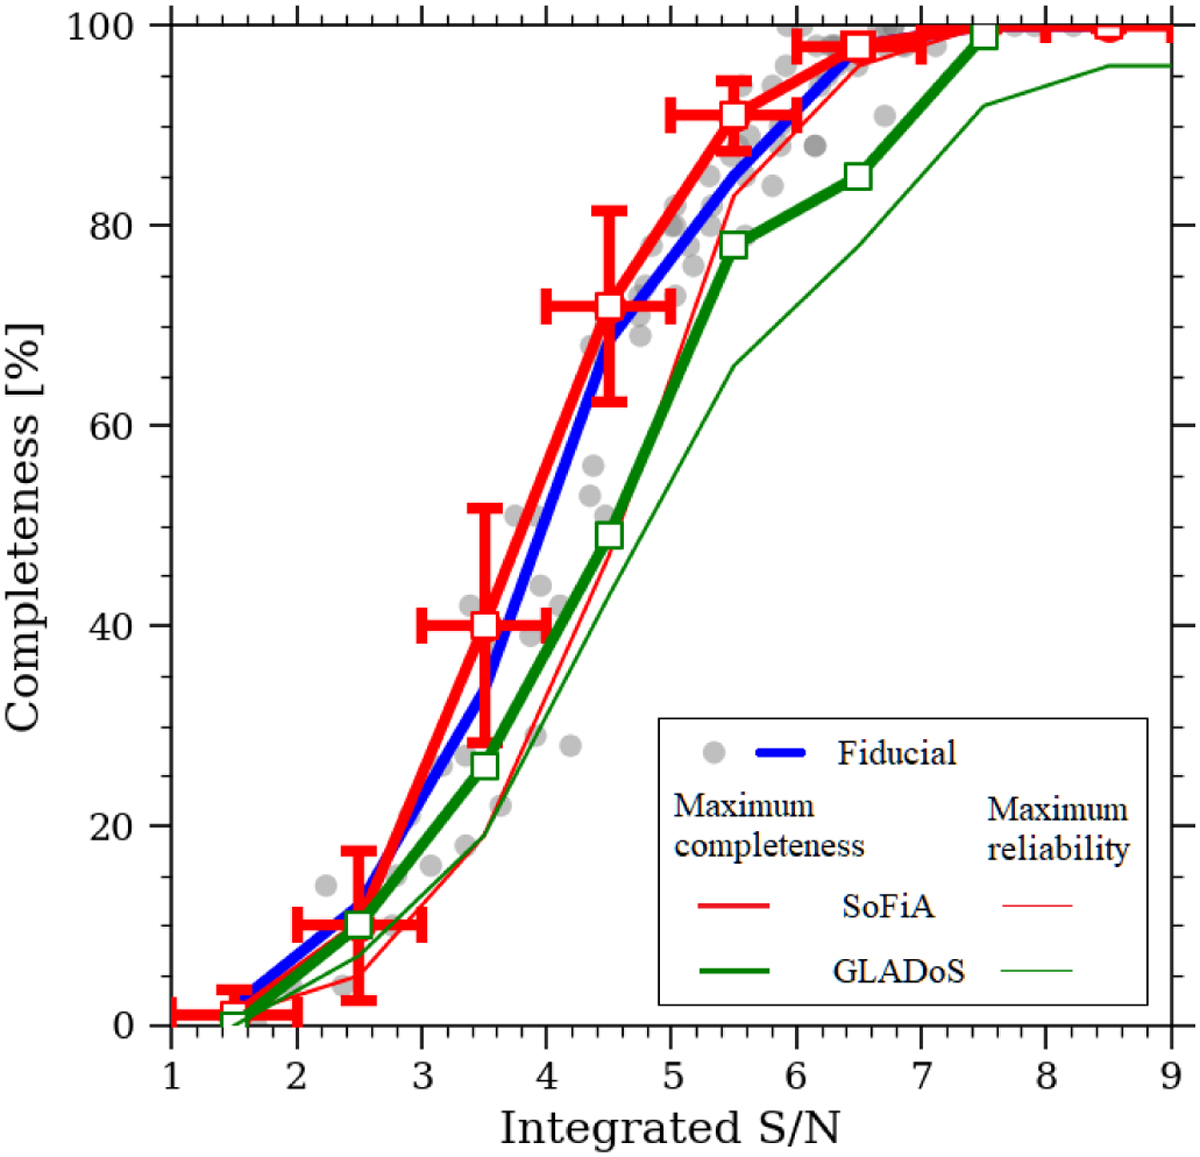
Comparison of the results of the fiducial visual source extraction experiment described in Sect. 3 with automatic algorithms. Completeness is shown as a function of S/Nint. The grey points and blue line (here omitting the error bar for clarity; see Fig. 5) shows the fiducial visual experiment, while SoFiA is shown with red lines and GLADoS by green lines. Thick lines show the results after optimising the algorithms to maximise completeness whereas the thin lines are attempts to maximise reliability.
Current usage metrics show cumulative count of Article Views (full-text article views including HTML views, PDF and ePub downloads, according to the available data) and Abstracts Views on Vision4Press platform.
Data correspond to usage on the plateform after 2015. The current usage metrics is available 48-96 hours after online publication and is updated daily on week days.
Initial download of the metrics may take a while.