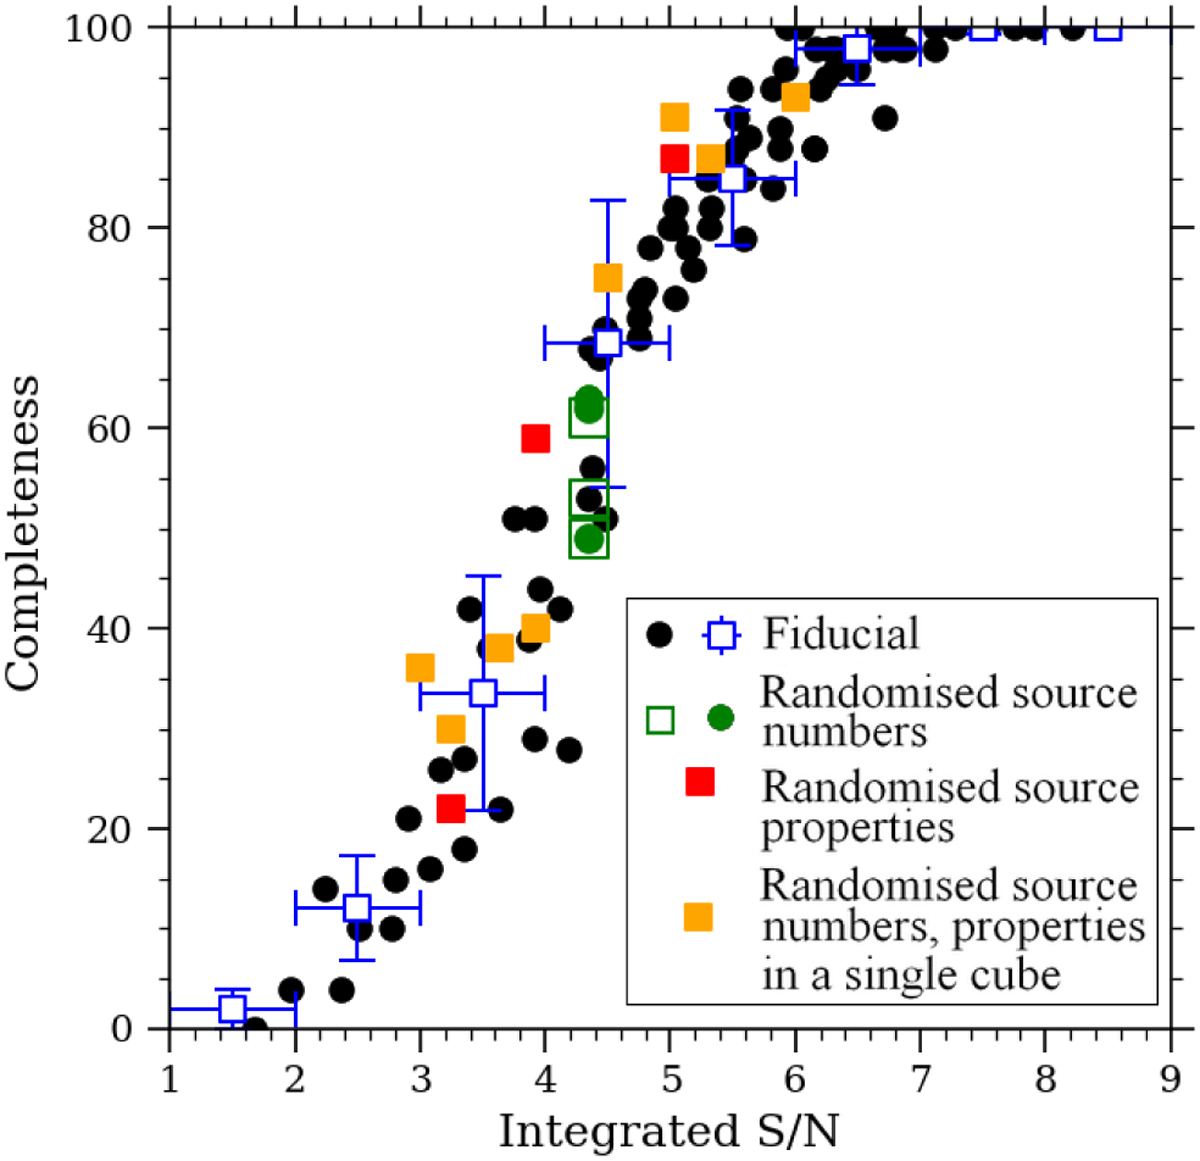
Fig. 8
Download original image
Black points and blue squares are the same as in Fig. 5, with other points from the experiments described in Sect. 4. Specifically, open green squares describe the control test of Sect. 4.1, which is run as in the fiducial case but at a precise S/Nint value of 1.945. The filled green circles show the corresponding tests at the same S/Nint value but with random numbers of sources injected, so that the observer had no knowledge of the probability a source was present. The filled red squares are as in Sect. 4.2, in which the observer had no knowledge of source line width or peak S/N and cubelets were inspected in random order, with no information given as to whether identifications were correct until the whole set of cubes was inspected. The filled orange squares are from the test described in Sect. 4.3, where numbers, line width, and peak S/N were all randomised at different S/Nint levels and sources were injected into a single large data cube rather than the standard set of 100 cubelets.
Current usage metrics show cumulative count of Article Views (full-text article views including HTML views, PDF and ePub downloads, according to the available data) and Abstracts Views on Vision4Press platform.
Data correspond to usage on the plateform after 2015. The current usage metrics is available 48-96 hours after online publication and is updated daily on week days.
Initial download of the metrics may take a while.