Fig. 7
Download original image
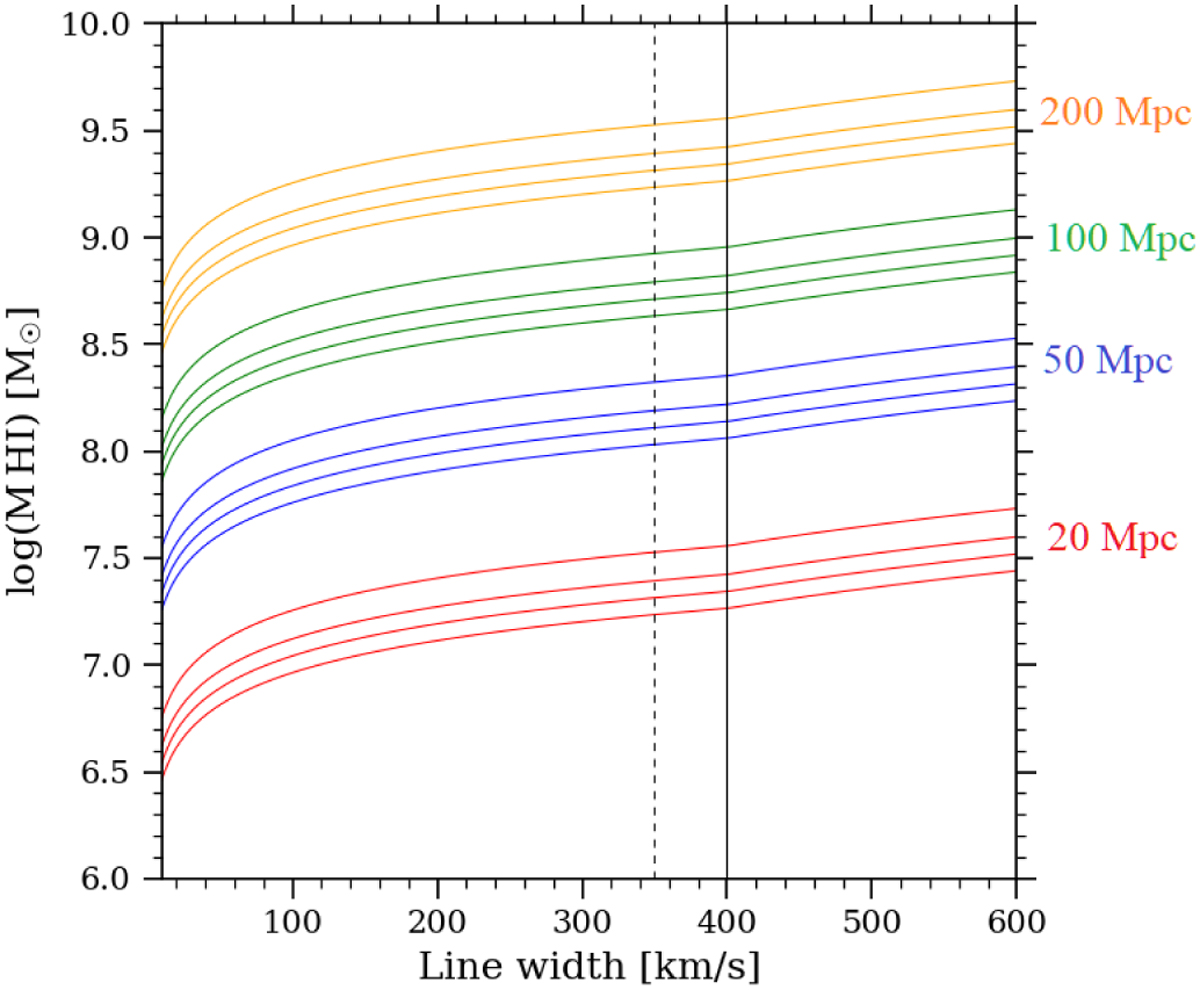
Mass-completeness contours for AGES at different distances. At each distance, the contours represent 25, 50, 75, and 100% completeness levels, in ascending order. The dashed vertical line shows the 350 km s−1 limit of the experimental results presented here, while the line at 400 km s−1 indicates the break in the velocity smoothing function as described in S07.
Current usage metrics show cumulative count of Article Views (full-text article views including HTML views, PDF and ePub downloads, according to the available data) and Abstracts Views on Vision4Press platform.
Data correspond to usage on the plateform after 2015. The current usage metrics is available 48-96 hours after online publication and is updated daily on week days.
Initial download of the metrics may take a while.