Fig. 5
Download original image
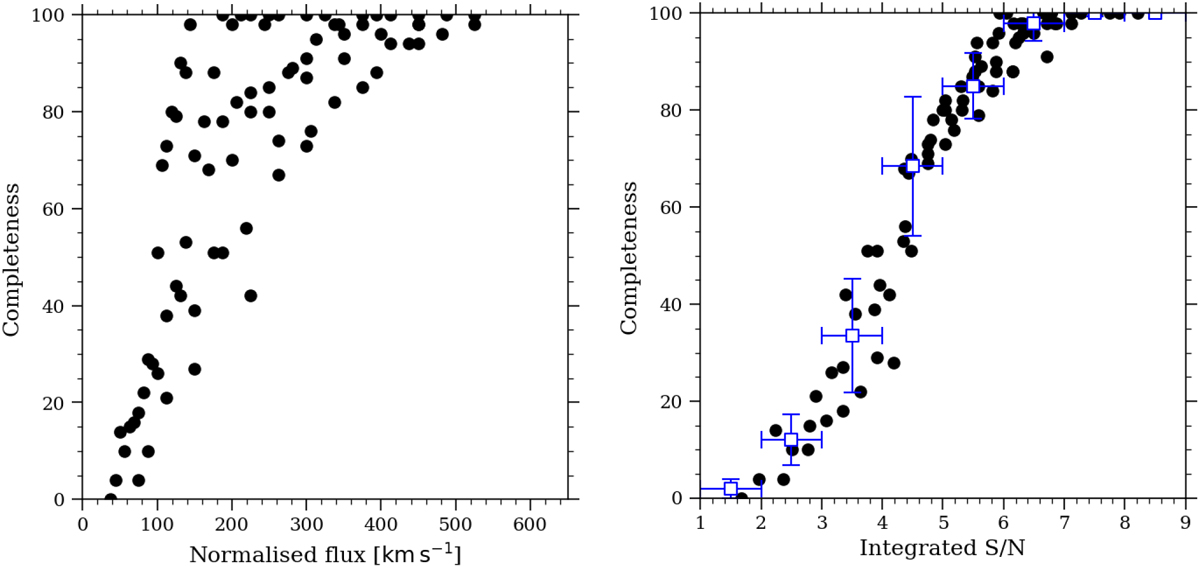
Left panel: completeness as a function of equivalent flux or mass. Right panel: completeness as a function of the integrated S/N parameter given in S07 and here in Eq. (1). The blue boxes show the median completeness level (with 1σ vertical error bars) in bins of width 1.0 (indicated by the horizontal error bars; see Sect. 5).
Current usage metrics show cumulative count of Article Views (full-text article views including HTML views, PDF and ePub downloads, according to the available data) and Abstracts Views on Vision4Press platform.
Data correspond to usage on the plateform after 2015. The current usage metrics is available 48-96 hours after online publication and is updated daily on week days.
Initial download of the metrics may take a while.