Open Access
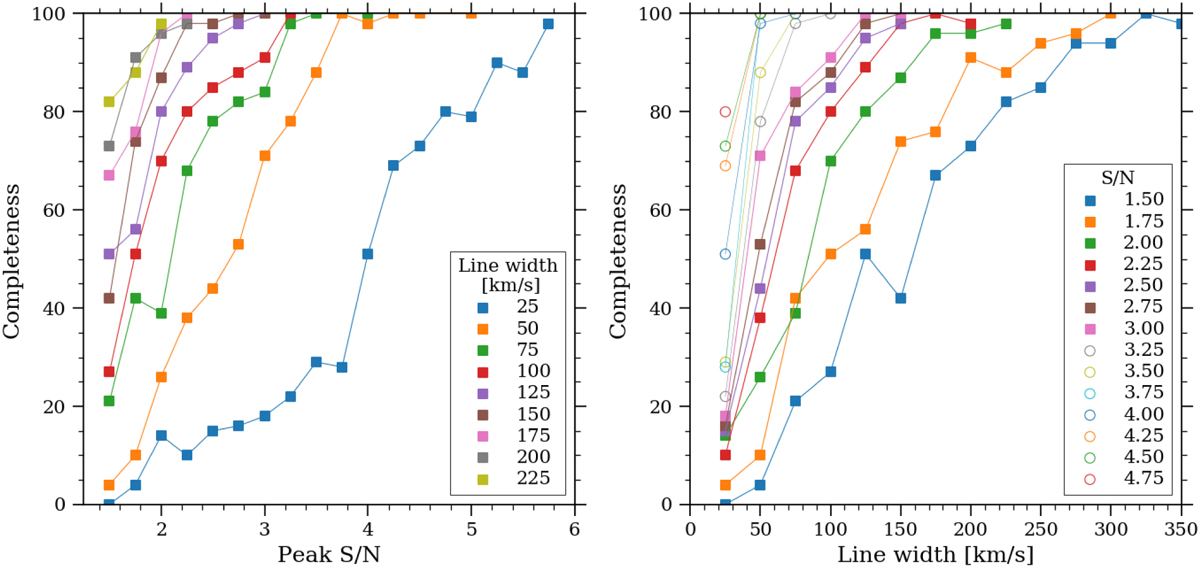
Fig. 4
Download original image
Completeness as a function of peak S/N (left) and line width (right), with one line per line width or peak S/N level, respectively. The range of S/N and line widths has been truncated to avoid confusion; lines with only one or two data points have been removed. Higher values simply show uniformly higher completeness levels.
Current usage metrics show cumulative count of Article Views (full-text article views including HTML views, PDF and ePub downloads, according to the available data) and Abstracts Views on Vision4Press platform.
Data correspond to usage on the plateform after 2015. The current usage metrics is available 48-96 hours after online publication and is updated daily on week days.
Initial download of the metrics may take a while.