Fig. 3
Download original image
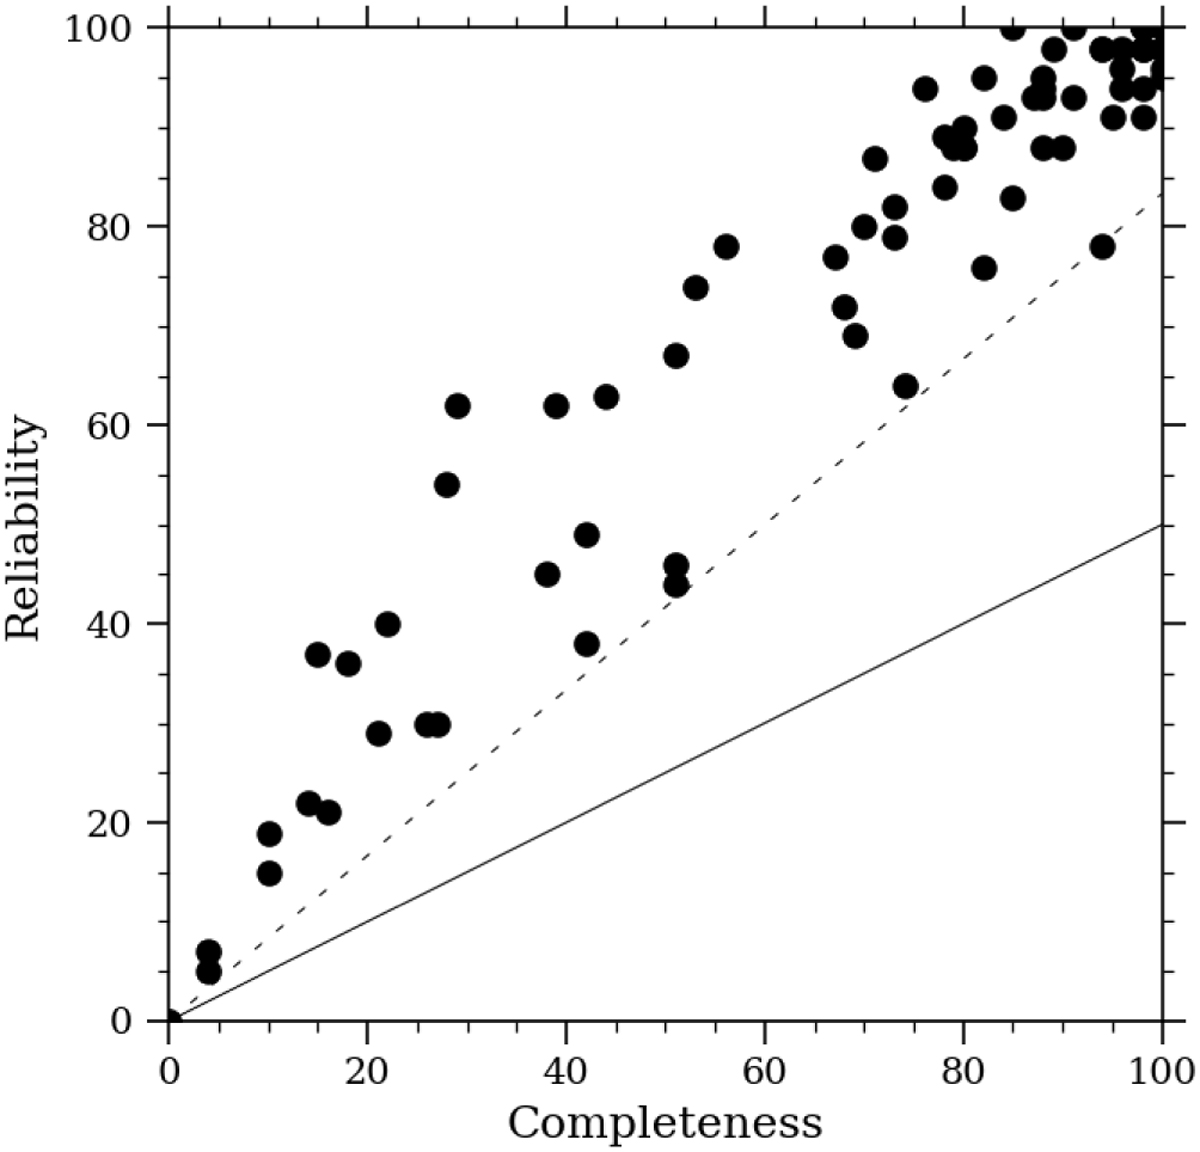
Reliability as a function of completeness. A clear correlation can be seen, but this is partly due to numerical limits. The solid line shows the minimum reliability if a spurious source had been found in every data cube in addition to the actual sources found, which would be always 50% of the completeness. The dashed line shows a more realistic estimate, accounting for the fact that no more than 60 detections were ever made.
Current usage metrics show cumulative count of Article Views (full-text article views including HTML views, PDF and ePub downloads, according to the available data) and Abstracts Views on Vision4Press platform.
Data correspond to usage on the plateform after 2015. The current usage metrics is available 48-96 hours after online publication and is updated daily on week days.
Initial download of the metrics may take a while.