Fig. 2
Download original image
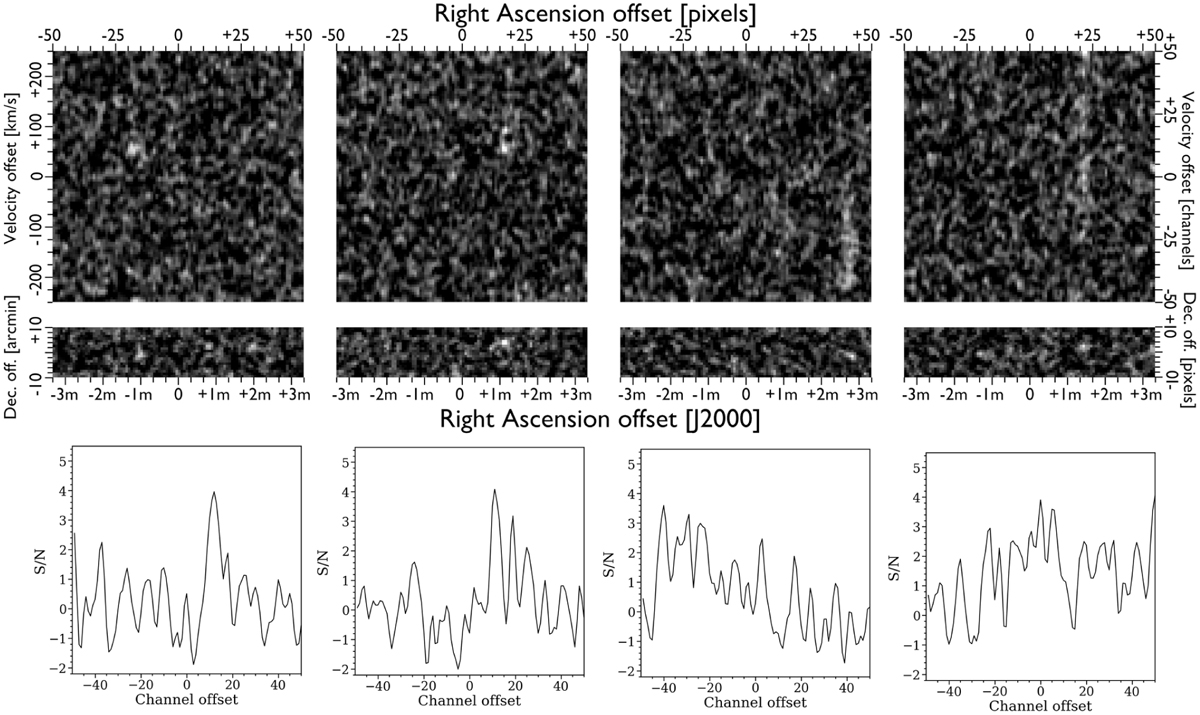
Examples of artificial sources injected into real empty data cubes. The top row shows the PV diagrams, the middle row shows the sky projections, and the bottom row shows the spectra at the location of the source. World coordinates are given relative to the centre of each dataset. For both the PV diagrams and sky projections, the data slices are chosen to show where the sources are most clearly visible (in most velocity channels they are considerably fainter, usually indistinguishable from the noise). From left to right: line widths are 50, 100, 200 and 350 km s−1; peak S/N values are 1.75, 1.75, 1.75 and 1.50. All of these sources were detected in the search. Sources are deliberately not marked and locating them is left as an exercise for the reader.
Current usage metrics show cumulative count of Article Views (full-text article views including HTML views, PDF and ePub downloads, according to the available data) and Abstracts Views on Vision4Press platform.
Data correspond to usage on the plateform after 2015. The current usage metrics is available 48-96 hours after online publication and is updated daily on week days.
Initial download of the metrics may take a while.