Fig. 10
Download original image
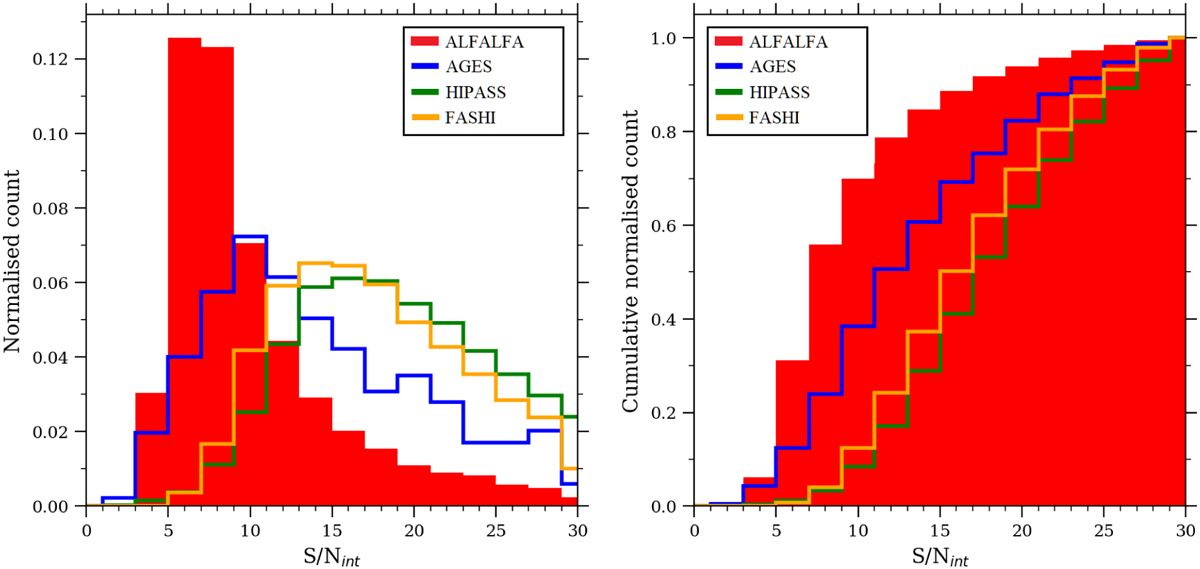
Comparison of the integrated S/N distribution for a selection of HI surveys as indicated in the legend. The left panel shows the normalised count, while the right panel shows the cumulative distribution. The horizontal range has been truncated to values <30 in order to show the shapes of the distribution more clearly. It should be noted that these S/Nint values, while calculated using the original survey data, do not present a fair comparison for assessing source extraction methods (see Fig. 11 for a more accurate comparison).
Current usage metrics show cumulative count of Article Views (full-text article views including HTML views, PDF and ePub downloads, according to the available data) and Abstracts Views on Vision4Press platform.
Data correspond to usage on the plateform after 2015. The current usage metrics is available 48-96 hours after online publication and is updated daily on week days.
Initial download of the metrics may take a while.