Fig. 1
Download original image
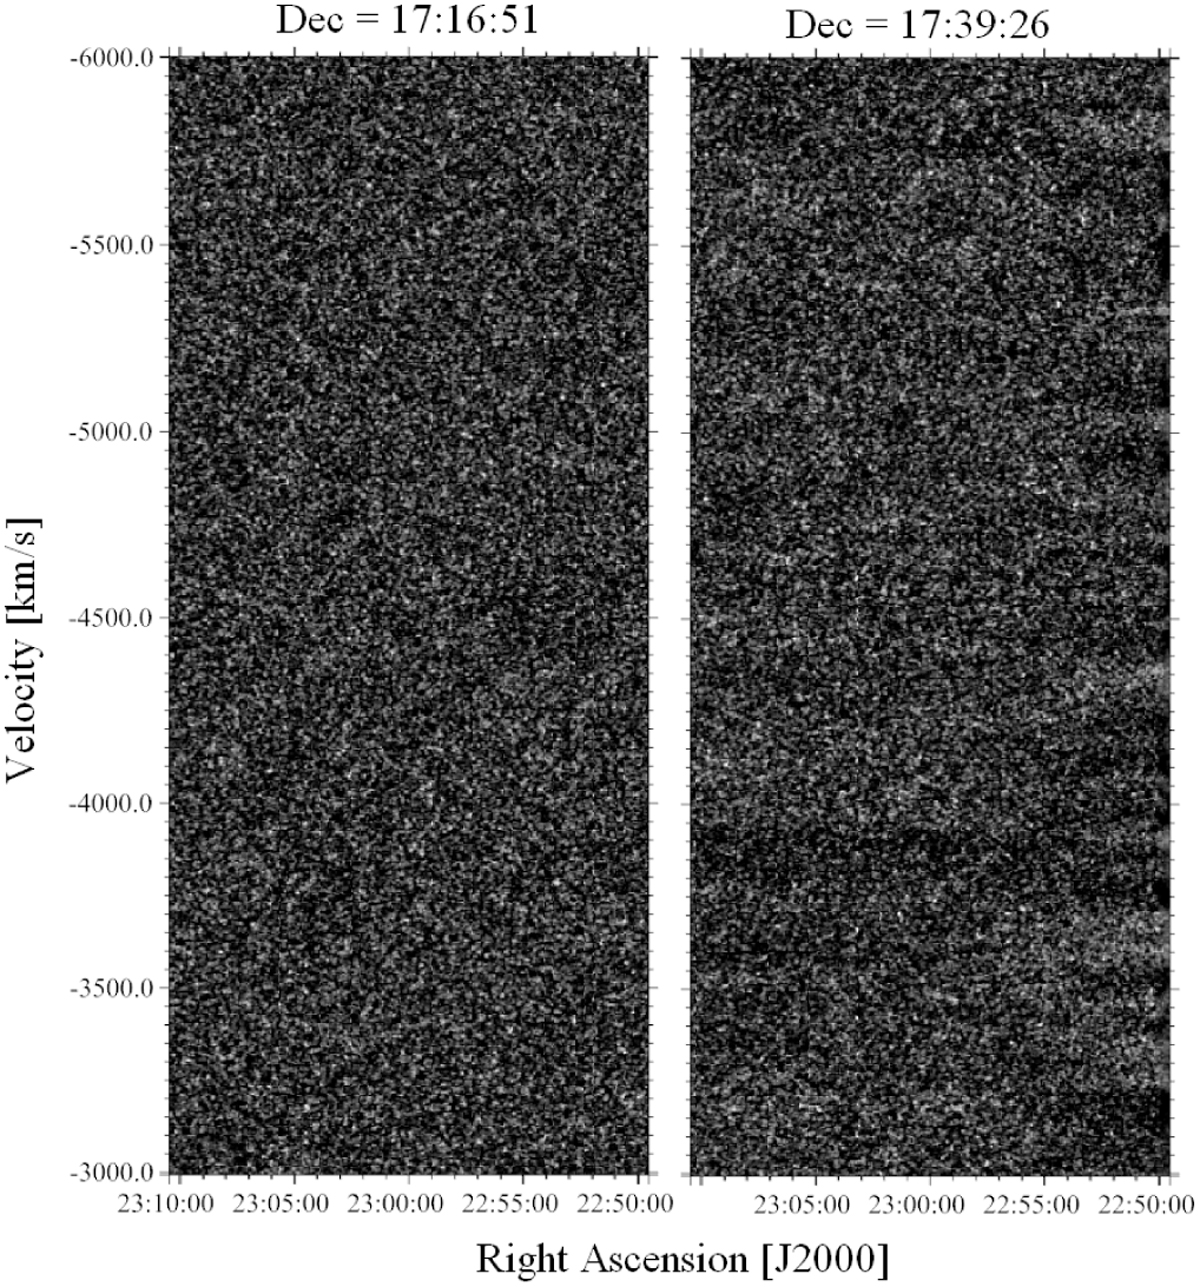
Example PV diagrams from the master cube after the processing described in Sect. 2.1. The data display a S/N range of −1.0 to 5.0, as described in Sect. 2.2. Two different declination slices are labelled. The left was chosen as an example of the typical data quality, where the noise is uniform. The right shows a more atypical region in which structures in the noise are clearly visible, a problem which affects about 5% of the data.
Current usage metrics show cumulative count of Article Views (full-text article views including HTML views, PDF and ePub downloads, according to the available data) and Abstracts Views on Vision4Press platform.
Data correspond to usage on the plateform after 2015. The current usage metrics is available 48-96 hours after online publication and is updated daily on week days.
Initial download of the metrics may take a while.