Fig. 7
Download original image
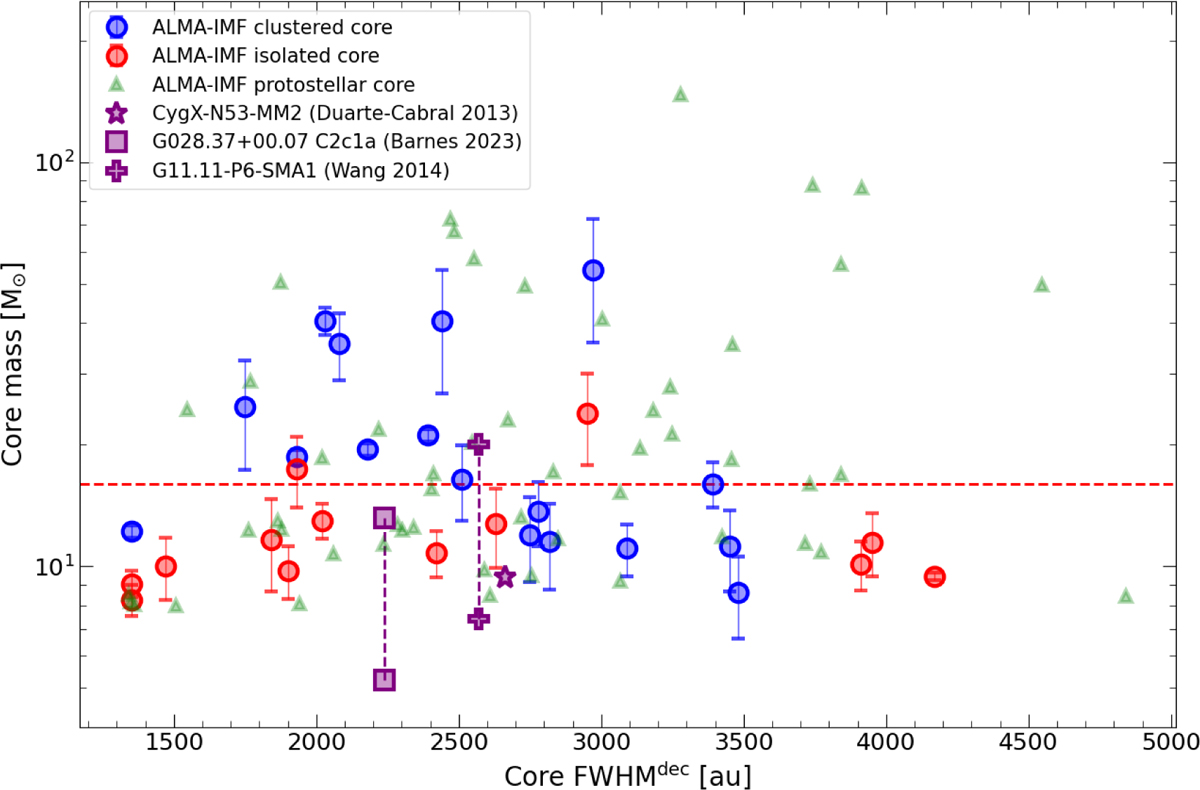
Mass distribution in function of the size of the total sample of 30 PSC candidates. The blue and red circles correspond to clustered and isolated candidates respectively. The errorbar symbols indicate the entire range of possible mass justified in Sect. 4.5, using 20 K and PPMAP uncorrected temperatures as lower and upper limits in temperature. The red dashed line corresponds to the threshold of 16 M⊙. The markers in purple are the previous high-mass PSC candidates from Duarte-Cabral et al. (2013), Barnes et al. (2023), and Wang et al. (2014) using the dust emissivity from the present work, a temperature of 20 K and the temperature used in these studies. The prestellar core from Duarte-Cabral et al. (2013) has only one symbol because a temperature of 20 K was already adopted in their work. Protostellar cores with M > 8 M⊙ are shown as green triangles.
Current usage metrics show cumulative count of Article Views (full-text article views including HTML views, PDF and ePub downloads, according to the available data) and Abstracts Views on Vision4Press platform.
Data correspond to usage on the plateform after 2015. The current usage metrics is available 48-96 hours after online publication and is updated daily on week days.
Initial download of the metrics may take a while.