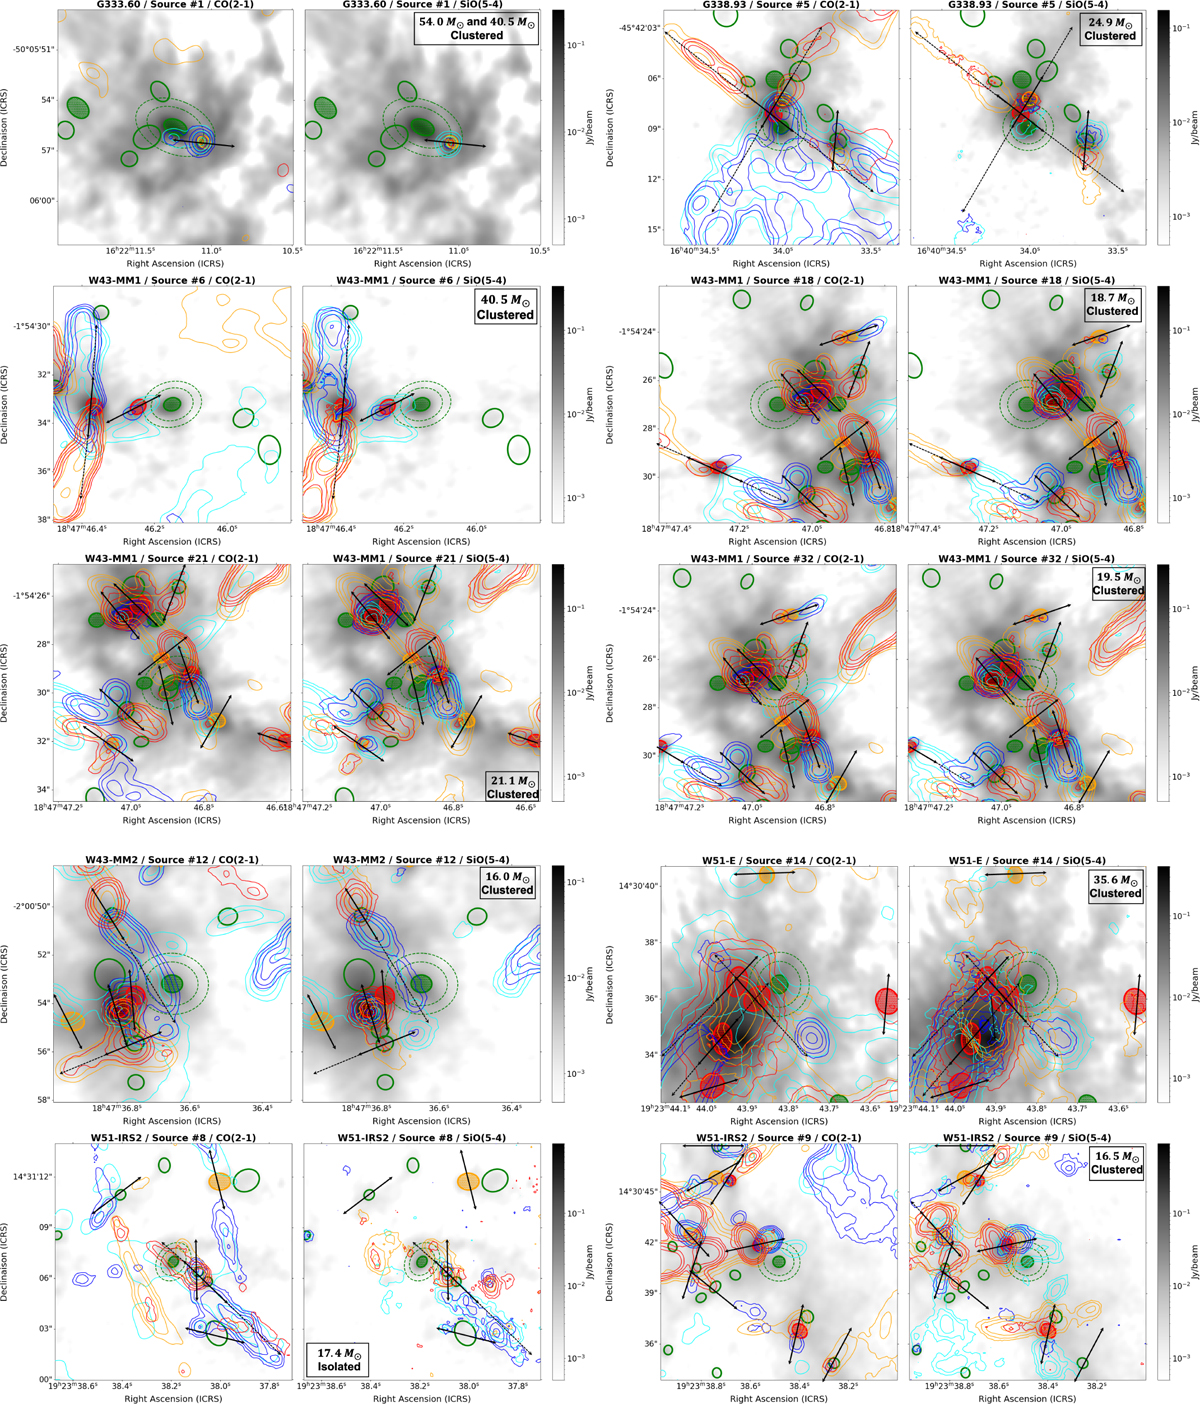
Fig. 5
Download original image
CO(2–1) and SiO(5–4) molecular outflow maps centered on the 12 most massive PSC candidates, represented as the center green ellipse with an annulus in each panel (cores #1A and #1B of G333.60 are displayed as one core here, see Sect. 4.4). The ellipses in red are cores classified as protostellar (due to an association with an outflow) with a mass greater than 8 M⊙, and ellipses in orange are protostellar cores with a mass between 4 and 8 M⊙. The filled green ellipses are other PSC candidates (i.e., with M > 8 M⊙ at 20 K) while the empty green ellipses are low-mass cores which have not been analyzed here. Moment 0 contours of the blueshifted wings are overlaid on the continuum map at low velocity in cyan and high-velocity in blue. Moment 0 contours of the redshifted wings are overlaid on the continuum map at low velocity in orange and high-velocity in red. The arrows represent the direction of the outflows driven by the protostars. The mass and the location of the candidate (i.e., classified as clustered or as isolated, see Sect. 5.3 for the details of the classification) are presented in each SiO map. The parameters of each map can be found on Zenodo (see also Appendix E).
continued.
Current usage metrics show cumulative count of Article Views (full-text article views including HTML views, PDF and ePub downloads, according to the available data) and Abstracts Views on Vision4Press platform.
Data correspond to usage on the plateform after 2015. The current usage metrics is available 48-96 hours after online publication and is updated daily on week days.
Initial download of the metrics may take a while.