Fig. 3
Download original image
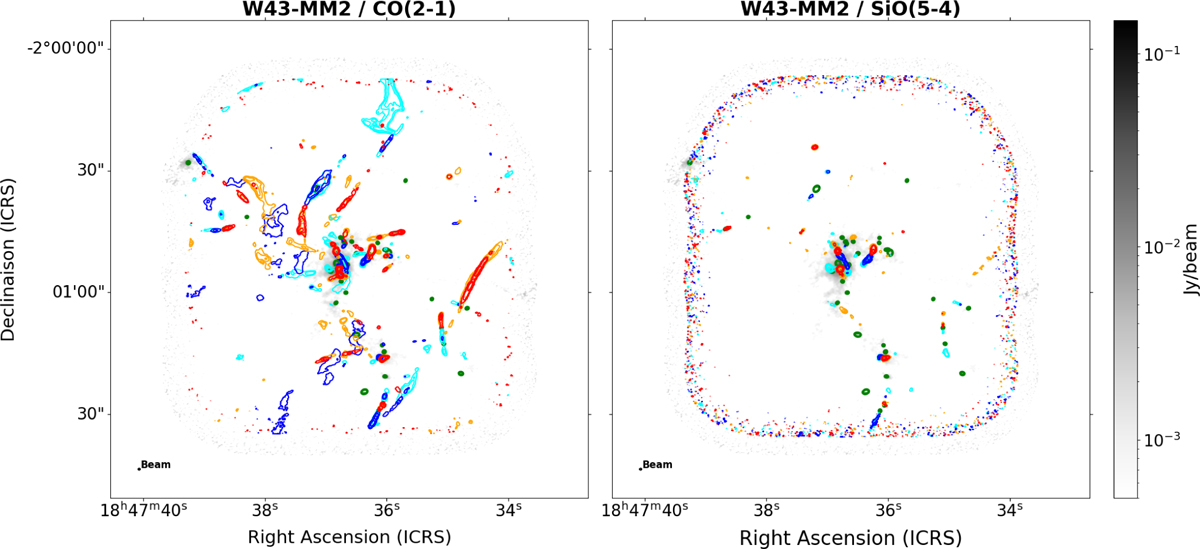
CO (left) and SiO (right) molecular outflows map of the W43-MM2 region overlaid on the 1.3 mm dust continuum map (in grayscale). The green ellipses represent the FWHM of the continuum cores convolved by the beam size. Moment 0 contours of the blueshifted wings are overlaid on the continuum map at low velocity in cyan and high-velocity in blue. Moment 0 contours of the redshifted wings are overlaid on the continuum map at low velocity in orange and high-velocity in red. CO and SiO contours are 10, 20, 40, and 80 in units of σ, with σ = 18.9, 11.0, 18.1, 6.4 mJy beam−1 km s−1 for CO, and σ = 4.4, 5.7, 4.5, 5.7 mJy beam−1 km s−1 for SiO, for cyan, blue, orange and red contours respectively. The corresponding velocity ranges are ±15–30 km s−1 and ±30–45 km s−1 for CO and ±10–25 km s−1 and ±25–50 km s−1 for SiO.
Current usage metrics show cumulative count of Article Views (full-text article views including HTML views, PDF and ePub downloads, according to the available data) and Abstracts Views on Vision4Press platform.
Data correspond to usage on the plateform after 2015. The current usage metrics is available 48-96 hours after online publication and is updated daily on week days.
Initial download of the metrics may take a while.