Fig. 2
Download original image
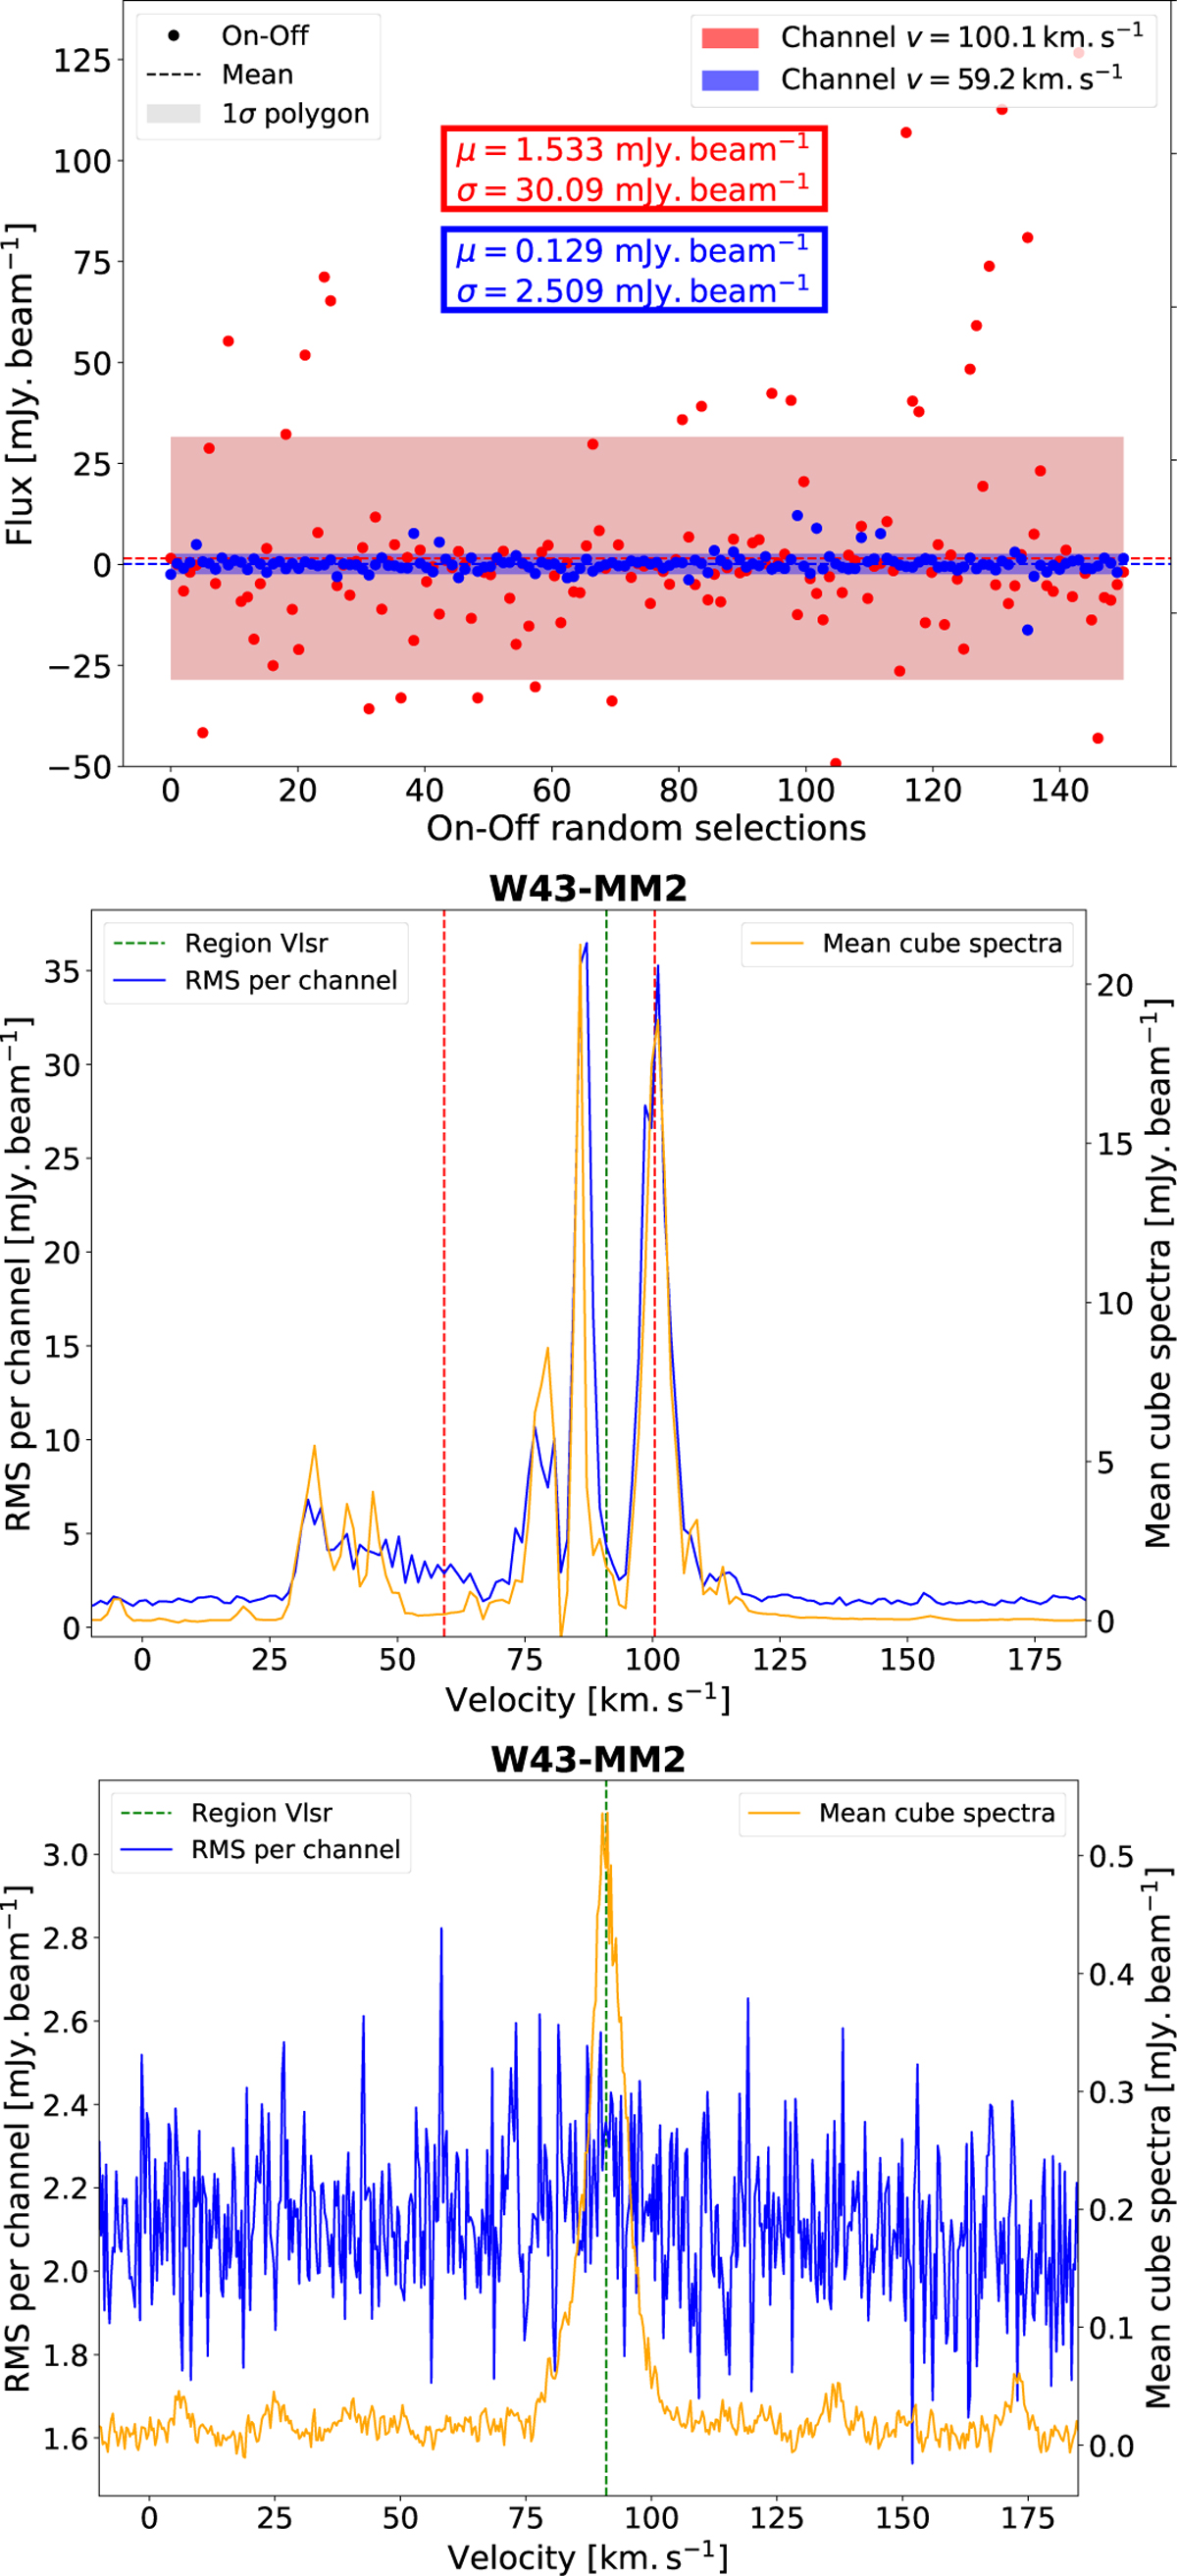
Top: Dispersion of the 150 On–Off random selections fluxes in the CO datacube of the region W43-MM2 for channels at velocities of 59.2 km s−1 and 100.1 km s−1. The mean (μ) and standard deviation (σ), which is assumed for the noise in a respective channel, are indicated in the panel. Middle: noise spectra of the CO datacube of the region W43-MM2 (in blue, left y-axis) overlaid with its mean cube spectra (in orange, right y-axis). The mean cube spectra is computed by averaging the fluxes of all the pixels (except those at the edges) at every channel. The green dotted line is centered on the VLSR of the region. The two channels represented in the top panel are indicated with the red dashed lines. Bottom: same as above for the SiO datacube.
Current usage metrics show cumulative count of Article Views (full-text article views including HTML views, PDF and ePub downloads, according to the available data) and Abstracts Views on Vision4Press platform.
Data correspond to usage on the plateform after 2015. The current usage metrics is available 48-96 hours after online publication and is updated daily on week days.
Initial download of the metrics may take a while.