Fig. A.1
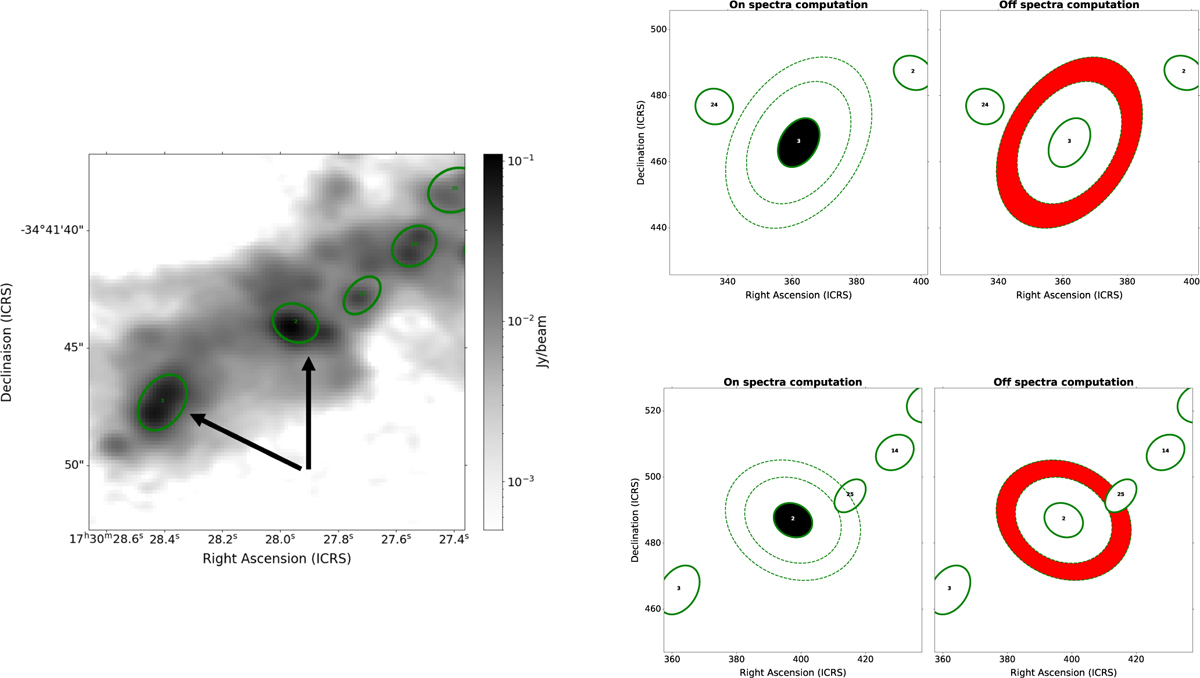
Download original image
Left: Zoomed-in image of continuum core #2 (top right) and #3 (bottom left) overlaid on the 1.3 mm continuum map of G353.41 (in grayscale). The green ellipses represent 1 time the FWHM of the continuum core. Right: Example of the On (black ellipse) and Off (red annulus) spectra computation for each core, used to estimate the core-averaged background-subtracted spectra. Core #3 (top) is the simplest case where no other core overlaps with its annulus (computed between 2.5 and 3.5 times the FWHM of the continuum core). Core #2 (bottom) has another core overlapping its annulus. The overlapping pixels are subtracted from the background estimation.
Current usage metrics show cumulative count of Article Views (full-text article views including HTML views, PDF and ePub downloads, according to the available data) and Abstracts Views on Vision4Press platform.
Data correspond to usage on the plateform after 2015. The current usage metrics is available 48-96 hours after online publication and is updated daily on week days.
Initial download of the metrics may take a while.