Fig. 10
Download original image
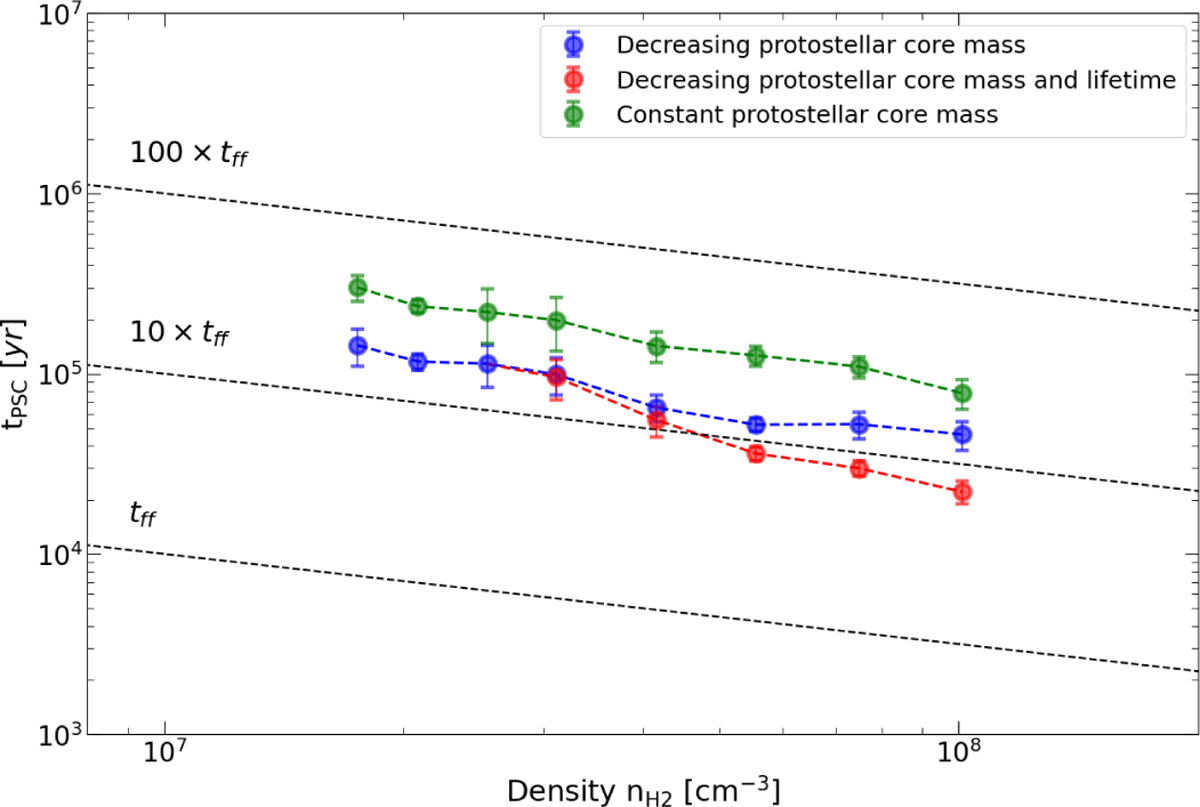
Statistical lifetime of the prestellar phase as a function of density. The green points represent the lifetimes and densities extracted from the right panel of Fig. 8, corresponding to the case of a constant protostellar core mass over time (clump-fed). The blue and red points correspond to the case of a decreasing protostellar core mass over time (core-fed). Tlue points are extracted from the right panel of Fig. 9, while the red points were computed assuming a decreasing protostellar lifetime between 16 M⊙ and 60 M⊙, from 300 kyr to 100 kyr. The black dashed lines represent 1,10 and 100 free-fall times.
Current usage metrics show cumulative count of Article Views (full-text article views including HTML views, PDF and ePub downloads, according to the available data) and Abstracts Views on Vision4Press platform.
Data correspond to usage on the plateform after 2015. The current usage metrics is available 48-96 hours after online publication and is updated daily on week days.
Initial download of the metrics may take a while.