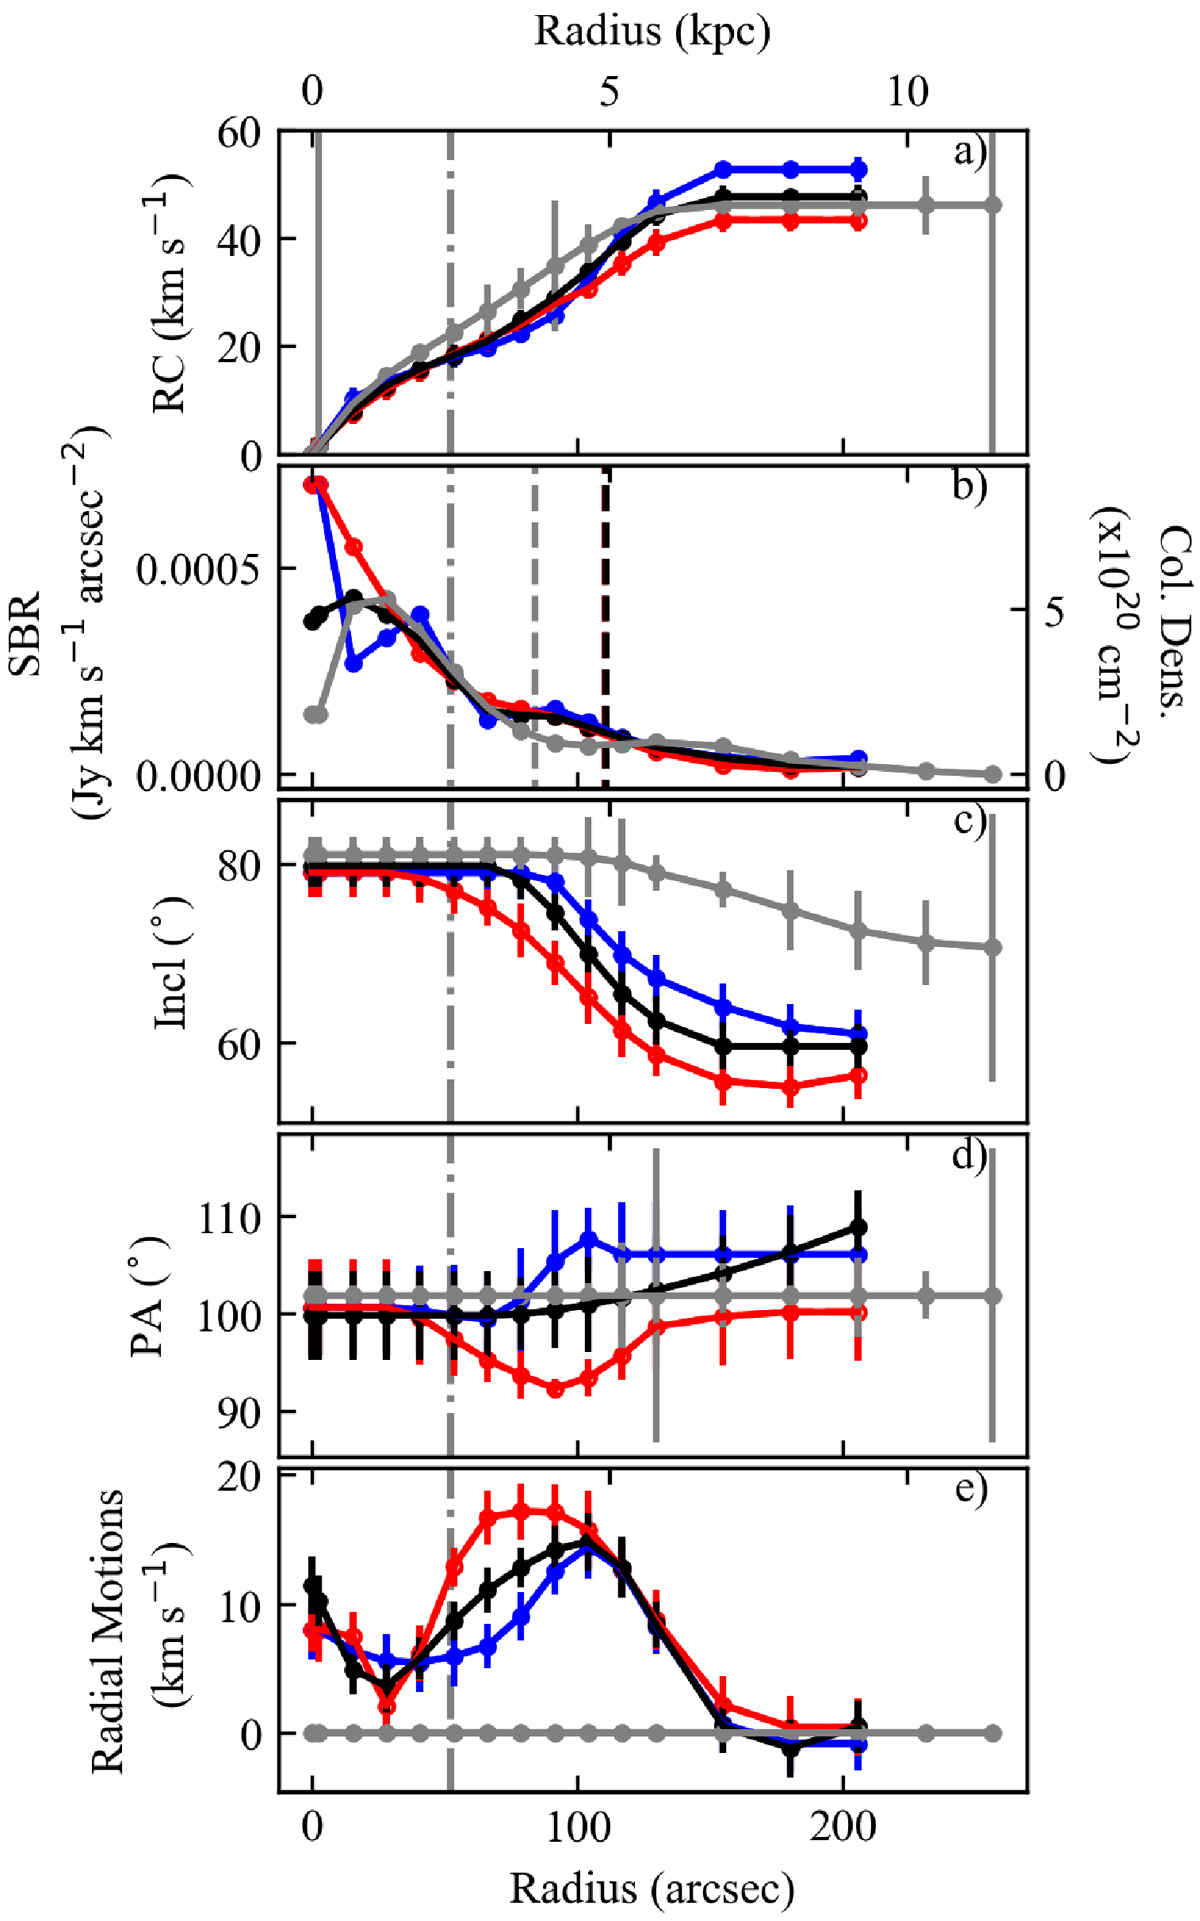
Fig. 5.
Download original image
Fitted parameters for the various models. Light gray lines represent the PYFAT model, black lines the single disk model, and the blue (approaching) and red (receding) lines the final best-fit model. The panels show the rotation velocities (a), surface brightness distribution (b), inclination (c), PA (d), and radial motions (e), all as function of radius. The vertical dot-dashed gray line indicates R25, and the vertical dashed lines in panel b mark where the surface brightness is equal to 1 M⊙ pc−2.
Current usage metrics show cumulative count of Article Views (full-text article views including HTML views, PDF and ePub downloads, according to the available data) and Abstracts Views on Vision4Press platform.
Data correspond to usage on the plateform after 2015. The current usage metrics is available 48-96 hours after online publication and is updated daily on week days.
Initial download of the metrics may take a while.