Open Access
Fig. 3.
Download original image
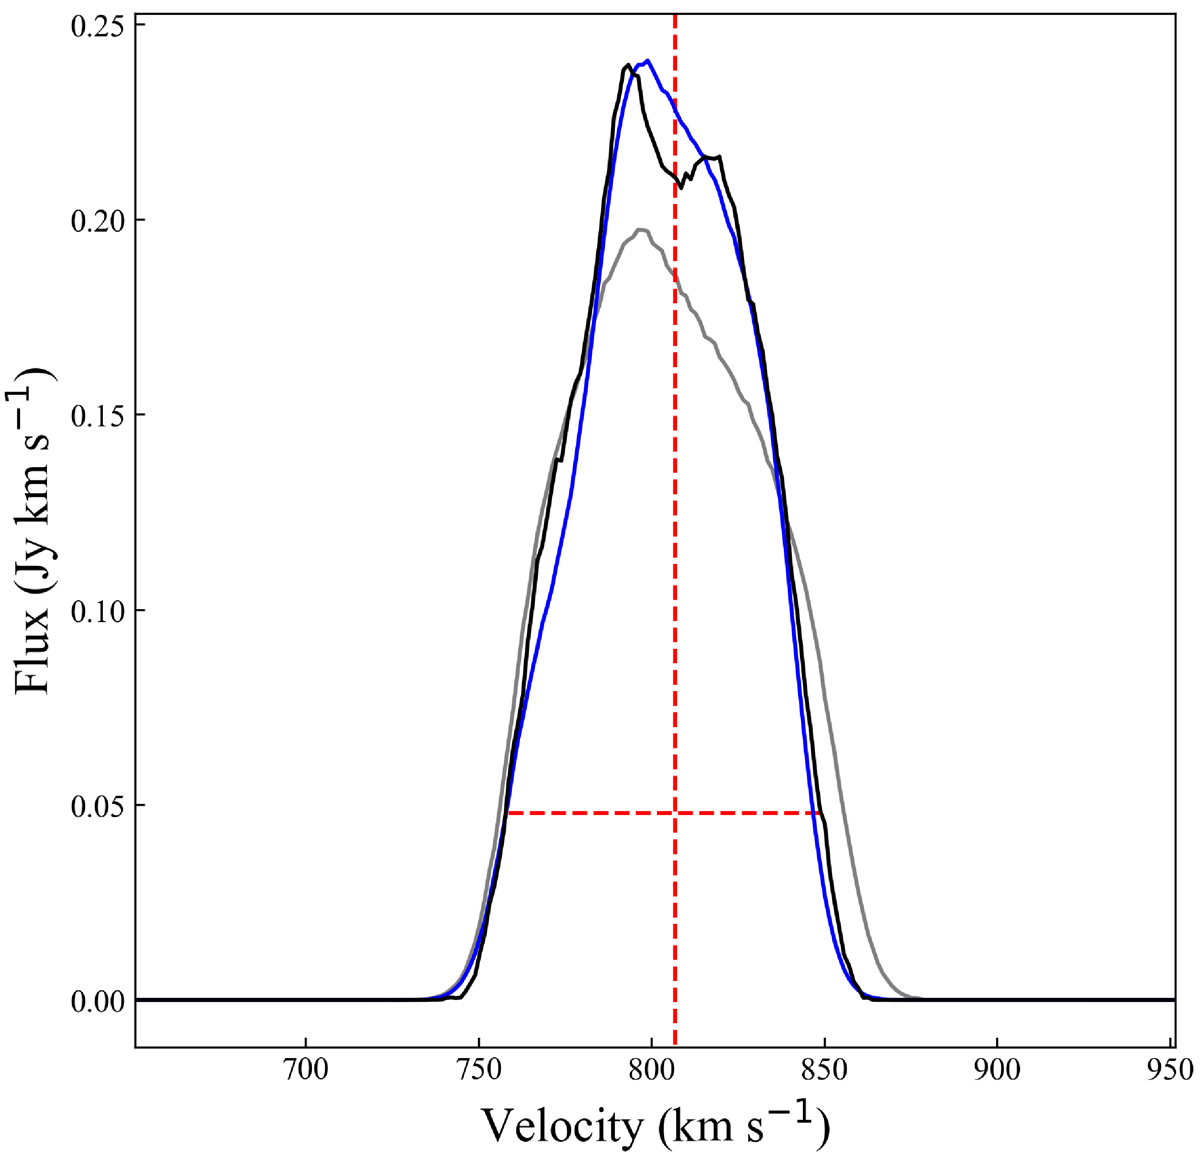
Global line profile of ESO 358-60. The black line indicates the data, the blue the best-fit model, and the gray the automatic model. The vertical dashed red line indicates the systemic velocity, and the horizontal line the uncorrected W20.
Current usage metrics show cumulative count of Article Views (full-text article views including HTML views, PDF and ePub downloads, according to the available data) and Abstracts Views on Vision4Press platform.
Data correspond to usage on the plateform after 2015. The current usage metrics is available 48-96 hours after online publication and is updated daily on week days.
Initial download of the metrics may take a while.