Fig. 2.
Download original image
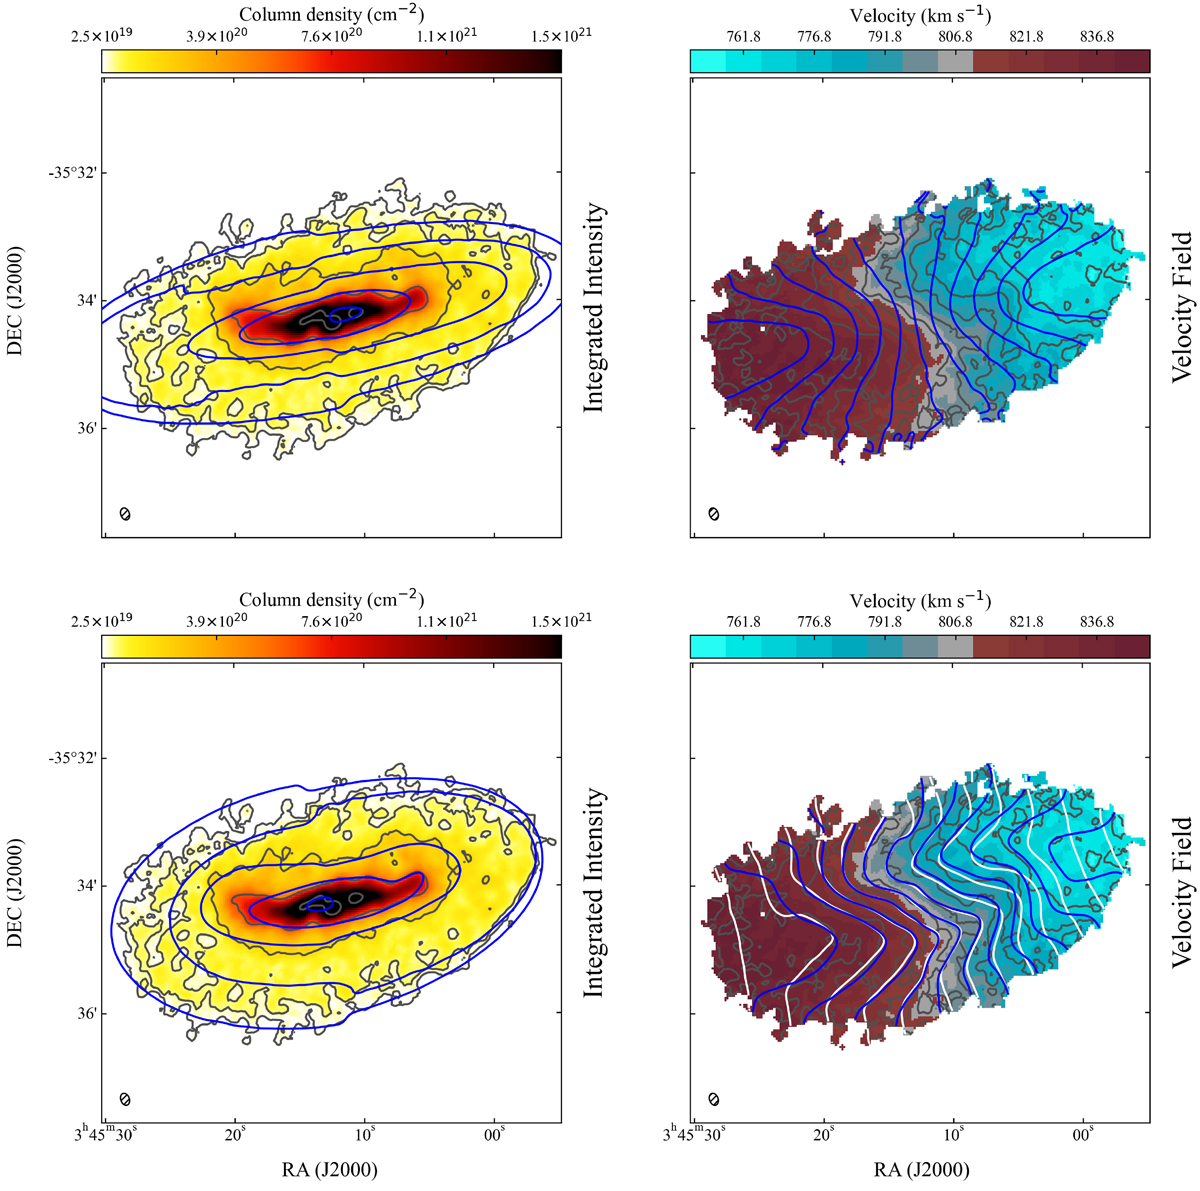
Moment maps of the H I in the galaxy ESO 358-60. Dark gray contours show the data. The blue contours indicate the automatic model (in the top panels) and the best-fit model (in the bottom panels). Left: Moment 0 or integrated intensity map of the galaxy. Contours are at ![]() . Right: Moment 1 or velocity field. Contours are centered on the systemic velocity (Vsys = 806.8 km s−1) and decrease (increase) in steps of 7.5 km s−1 for the approaching (receding) side. The white contours represent the best-fit model with a rising RC (see text). The ellipse in the bottom-left corner of the panels indicates the restoring beam of the observations.
. Right: Moment 1 or velocity field. Contours are centered on the systemic velocity (Vsys = 806.8 km s−1) and decrease (increase) in steps of 7.5 km s−1 for the approaching (receding) side. The white contours represent the best-fit model with a rising RC (see text). The ellipse in the bottom-left corner of the panels indicates the restoring beam of the observations.
Current usage metrics show cumulative count of Article Views (full-text article views including HTML views, PDF and ePub downloads, according to the available data) and Abstracts Views on Vision4Press platform.
Data correspond to usage on the plateform after 2015. The current usage metrics is available 48-96 hours after online publication and is updated daily on week days.
Initial download of the metrics may take a while.