Fig. 1.
Download original image
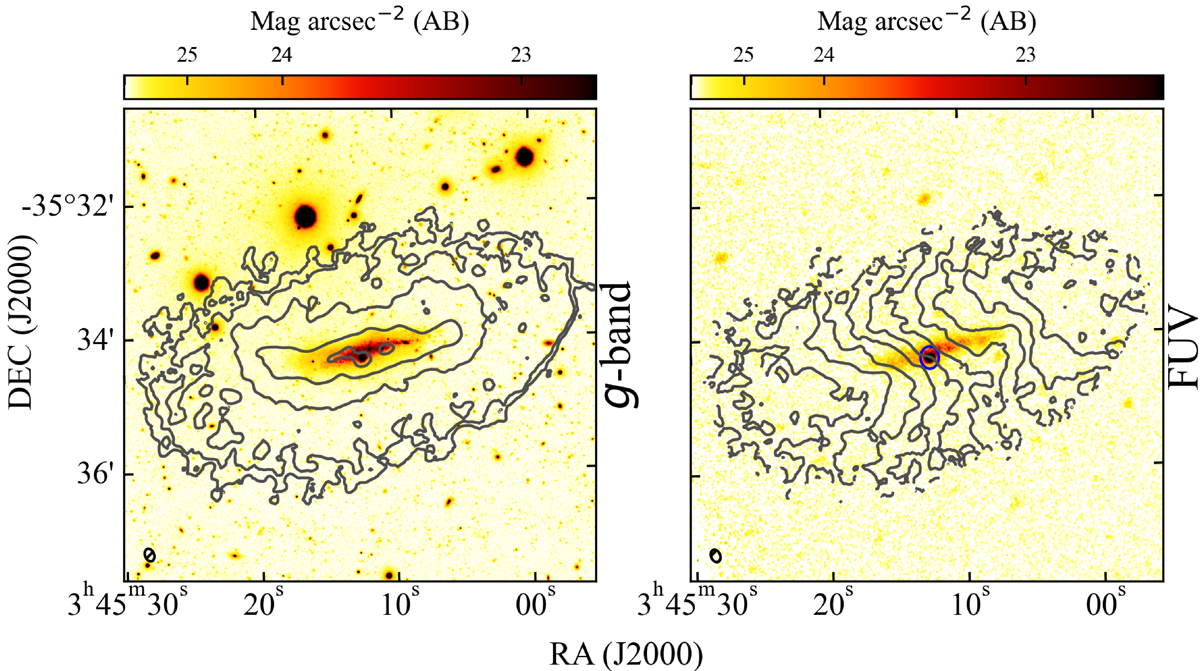
Left: g-band optical image from the Fornax Deep Survey (FDS; Iodice et al. 2016; Venhola et al. 2018) overlaid with intensity contours of the H I (see Fig. 2). Right: Far-ultraviolet image from GALEX observations overlaid with velocity contours extracted from the 21 cm observations (Fig. 2). The blue circle marks what appears to be a large star-forming region.
Current usage metrics show cumulative count of Article Views (full-text article views including HTML views, PDF and ePub downloads, according to the available data) and Abstracts Views on Vision4Press platform.
Data correspond to usage on the plateform after 2015. The current usage metrics is available 48-96 hours after online publication and is updated daily on week days.
Initial download of the metrics may take a while.