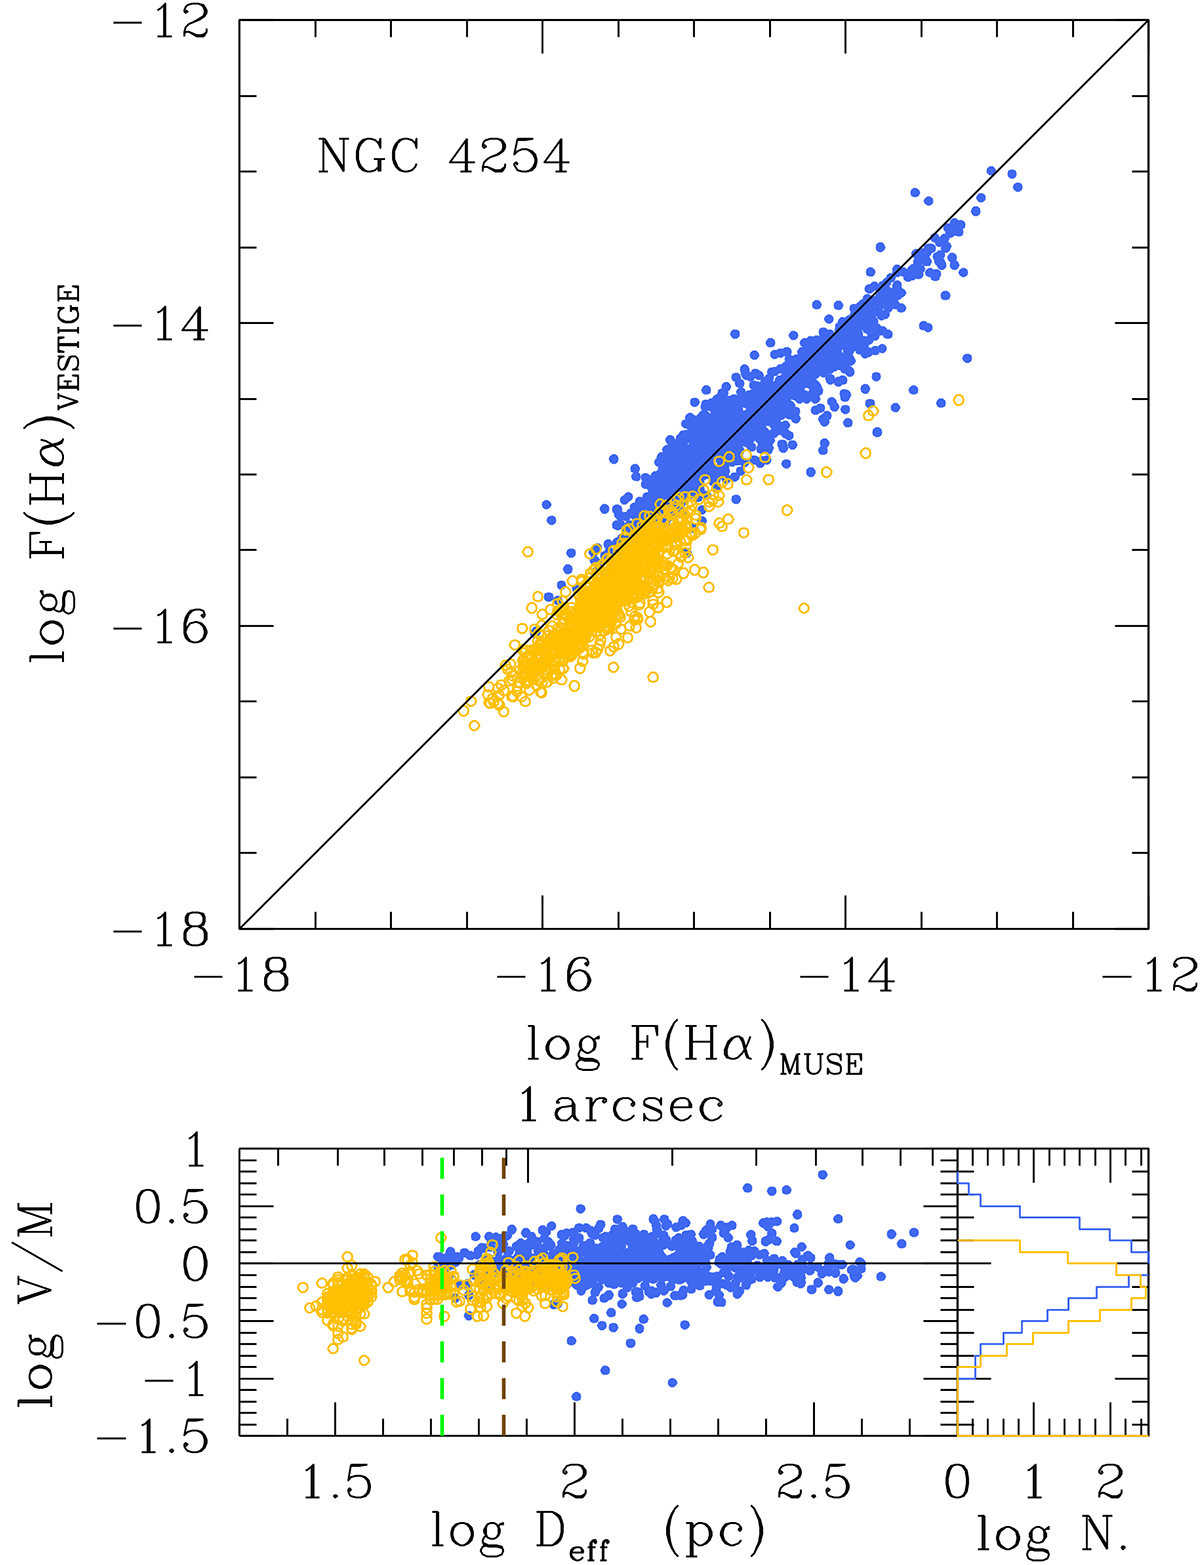
Fig. 4.
Download original image
Relationship between the flux of individual H II regions of NGC 4254 extracted from the VESTIGE images and from the MUSE/PHANGS datacubes. For consistency with the MUSE data, the VESTIGE data are the output of HIIPHOT uncorrected for the diffuse emission. The lower panel shows how the ratio of the VESTIGE-to-PHANGS flux ratio changes as a function of the effective diameter corrected for seeing smearing. The vertical green dashed line corresponds to the seeing of the VESTIGE image, the vertical brown dashed line to the seeing of the MUSE/PHANGS dataset. Blue dots (orange circles) are for H II regions with more (less) than 50 pixels in the VESTIGE image (regions with a typical radius of ≃0.75″). The distributions of their ratio is given in the lower right panel.
Current usage metrics show cumulative count of Article Views (full-text article views including HTML views, PDF and ePub downloads, according to the available data) and Abstracts Views on Vision4Press platform.
Data correspond to usage on the plateform after 2015. The current usage metrics is available 48-96 hours after online publication and is updated daily on week days.
Initial download of the metrics may take a while.