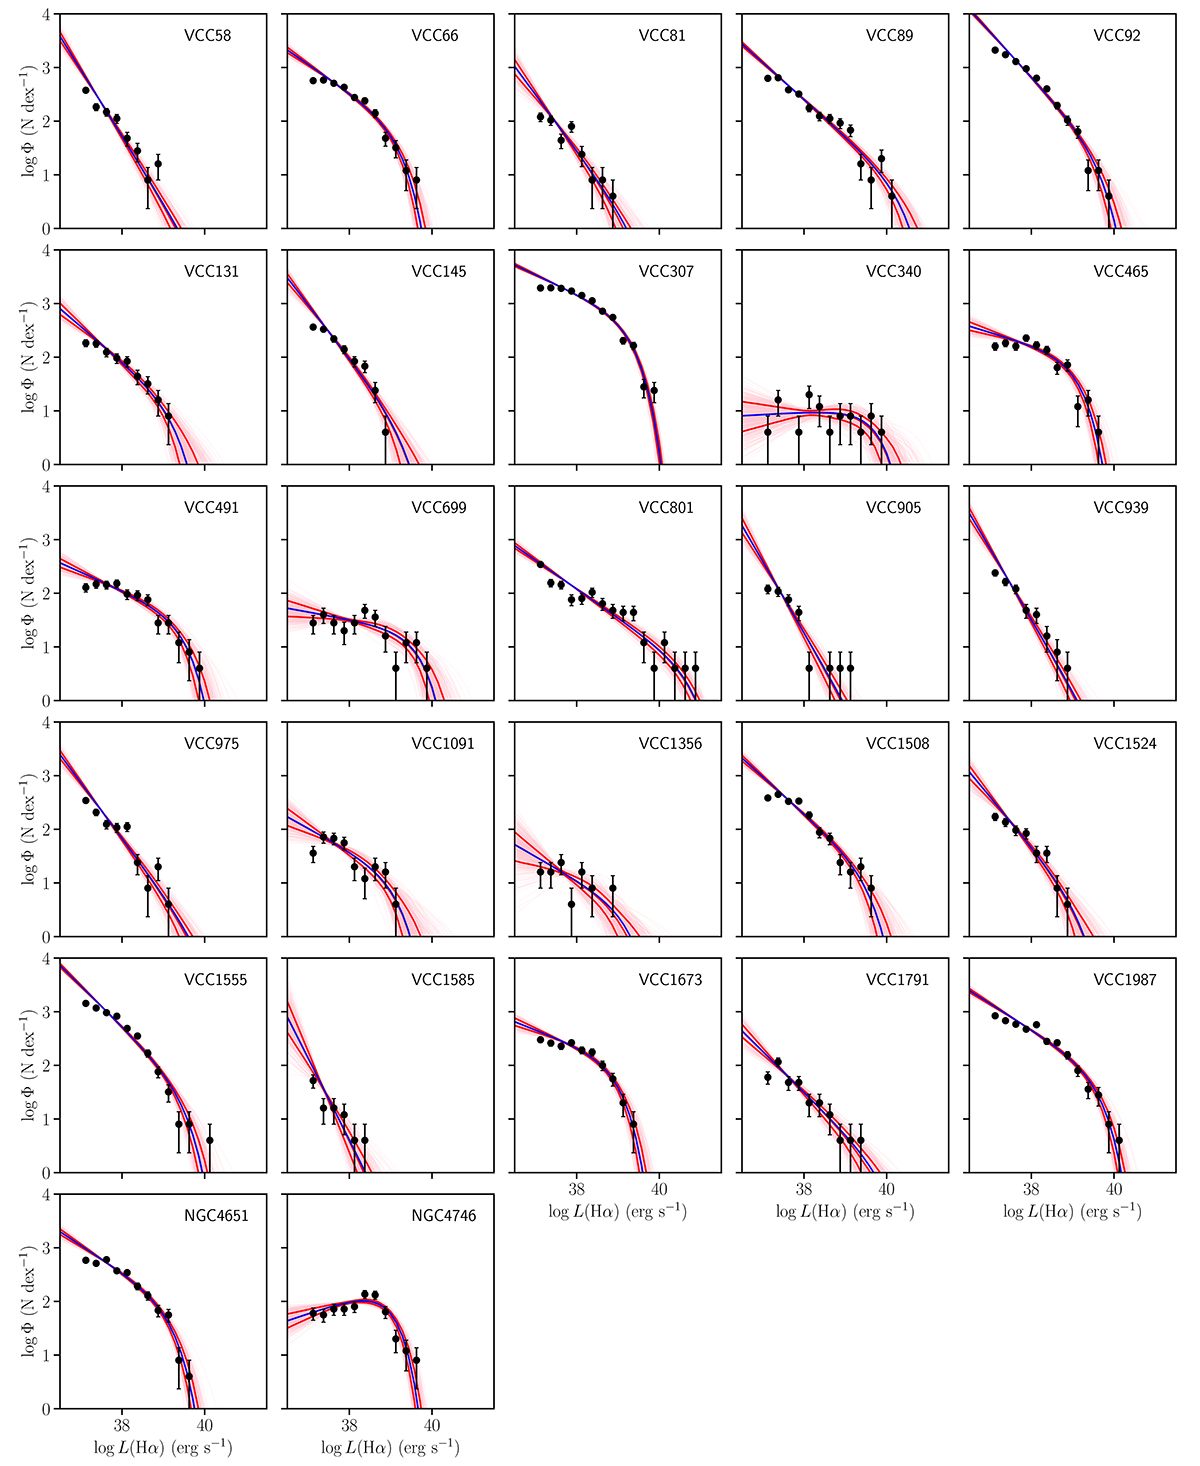
Fig. E.1.
Download original image
Luminosity function of the H II regions detected by HIIPHOT in individual galaxies. The Hα luminosity of individual H II regions is corrected for dust attenuation and [N II] contamination as described in Sec. 3.2. The solid blue and red lines indicate the best fit and 1σ confidence regions for the Schechter luminosity function parametrisation. Black solid dots indicate the number of H II regions in 0.25 dex bins of Hα luminosity above the adopted completeness of the survey (L(Hα) ≥ 1037 erg s−1).
Current usage metrics show cumulative count of Article Views (full-text article views including HTML views, PDF and ePub downloads, according to the available data) and Abstracts Views on Vision4Press platform.
Data correspond to usage on the plateform after 2015. The current usage metrics is available 48-96 hours after online publication and is updated daily on week days.
Initial download of the metrics may take a while.