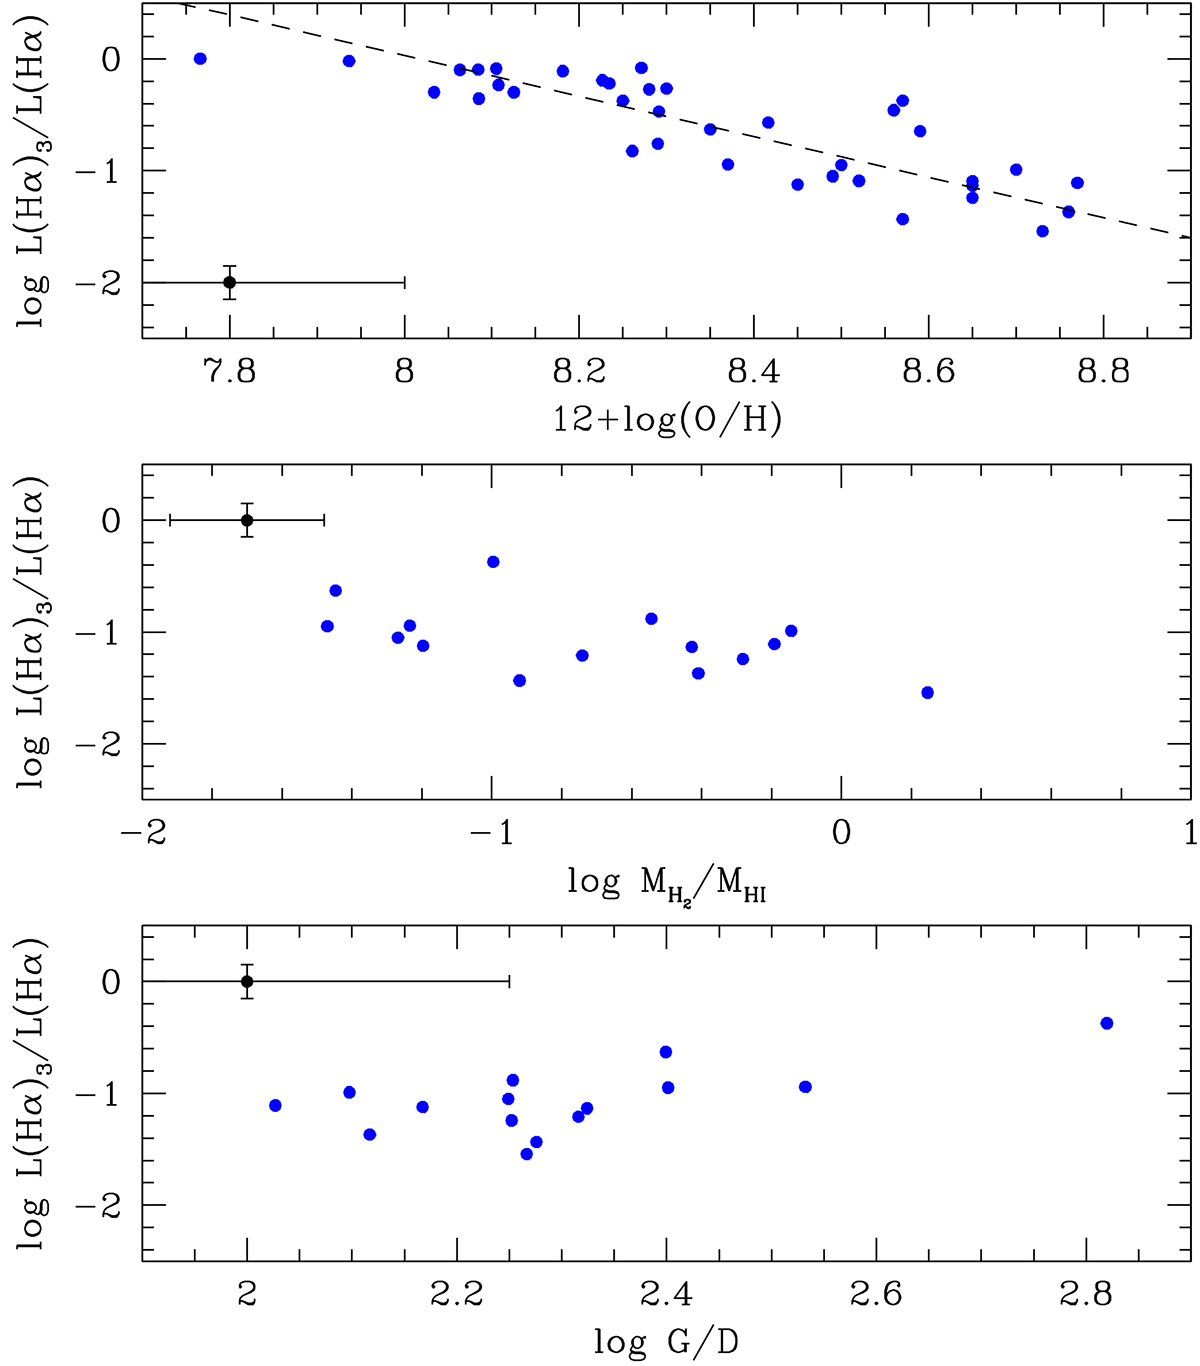
Fig. C.14.
Download original image
Relation between L(Hα)3/L(Hα) (contribution of the brightest three H II regions to the total Hα luminosity of the galaxy) and the total star formation rate (upper panel) and total stellar mass (lower panel) of the host galaxies. The black dashed line shows the best fit to the data (bisector fit), while the black dot the typical error in the data.
Current usage metrics show cumulative count of Article Views (full-text article views including HTML views, PDF and ePub downloads, according to the available data) and Abstracts Views on Vision4Press platform.
Data correspond to usage on the plateform after 2015. The current usage metrics is available 48-96 hours after online publication and is updated daily on week days.
Initial download of the metrics may take a while.