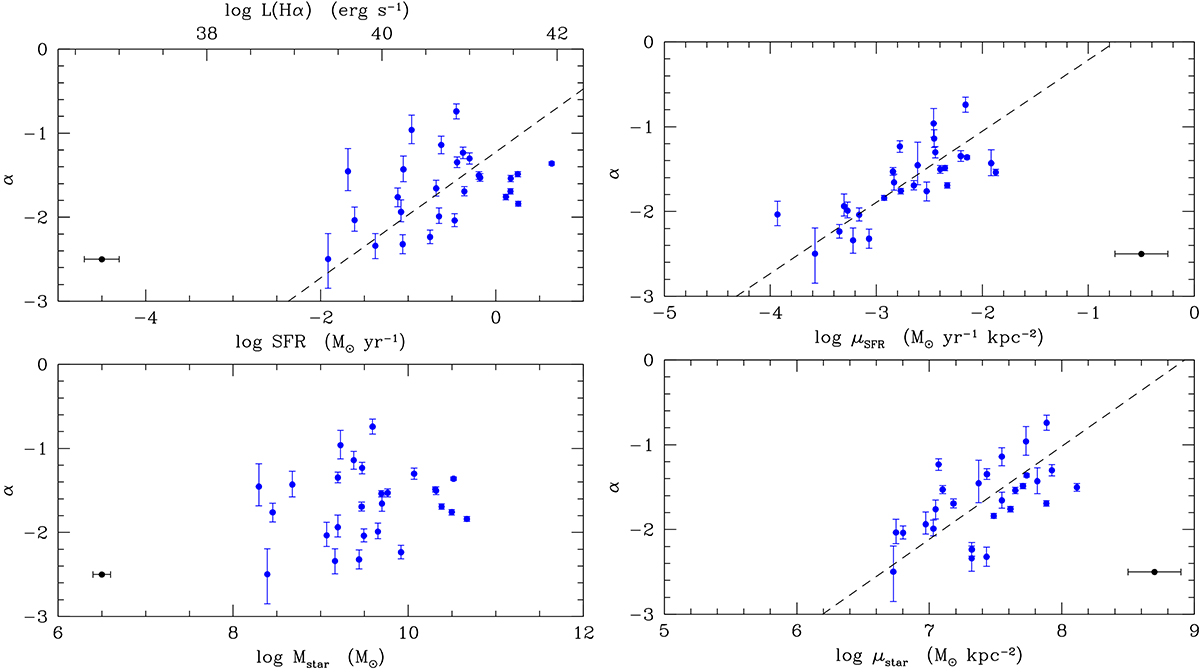
Fig. C.8.
Download original image
Relation between the faint end slope of the luminosity function α and the total star formation rate (upper left panel), total stellar mass (lower left), mean star formation rate surface density (upper right), and mean stellar mass surface density (lower right) of the host galaxies. The black dashed line shows the best fit to the data (bisector fit). The dots in the lower left and right corners show the typical error bar in the data.
Current usage metrics show cumulative count of Article Views (full-text article views including HTML views, PDF and ePub downloads, according to the available data) and Abstracts Views on Vision4Press platform.
Data correspond to usage on the plateform after 2015. The current usage metrics is available 48-96 hours after online publication and is updated daily on week days.
Initial download of the metrics may take a while.