Fig. 18.
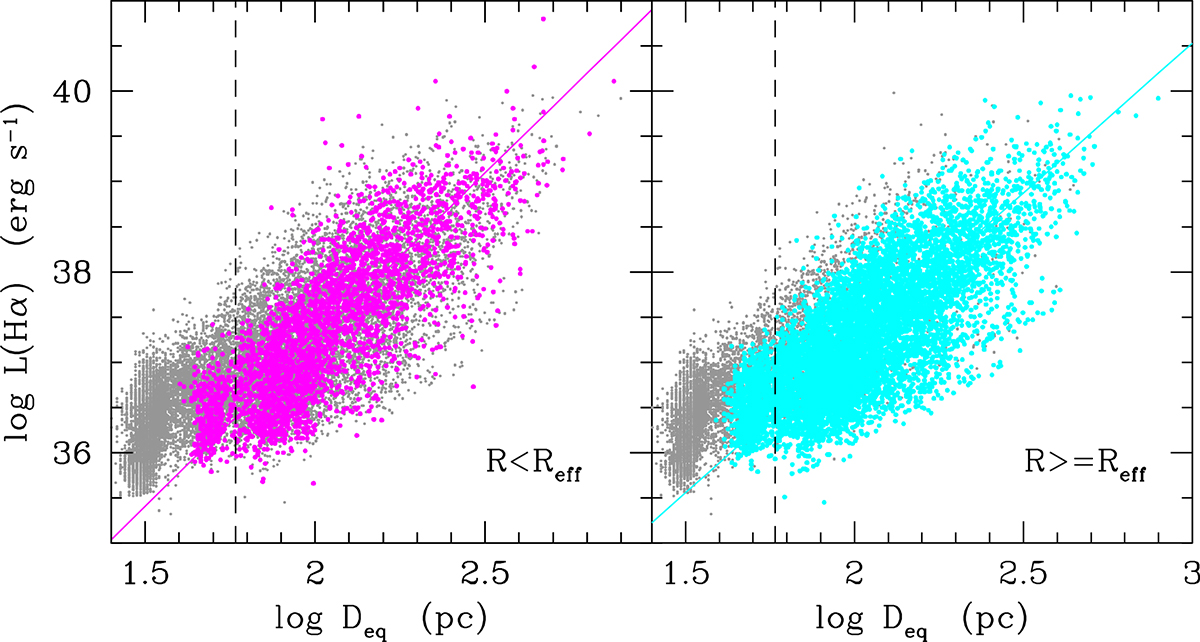
Download original image
Relation between the Hα luminosity of individual H II regions corrected for [N II] contamination and dust attenuation and the equivalent diameter corrected for seeing effects for regions located within (right, filled magenta dots) and outside (left, filled cyan dots) the i-band effective radius of the parent galaxy, where the correction is less than 50%. Grey dots show all H II regions with no limits in luminosity and diameter correction. The vertical dashed line shows the mean FWHM of the survey assuming galaxies at the distance of the main body of the cluster (16.5 Mpc). The magenta and cyan solid lines give the bisector fit of the relations derived for galaxies with a diameter correction factor ≤50% (magenta and cyan filled dots).
Current usage metrics show cumulative count of Article Views (full-text article views including HTML views, PDF and ePub downloads, according to the available data) and Abstracts Views on Vision4Press platform.
Data correspond to usage on the plateform after 2015. The current usage metrics is available 48-96 hours after online publication and is updated daily on week days.
Initial download of the metrics may take a while.