Fig. 15.
Download original image
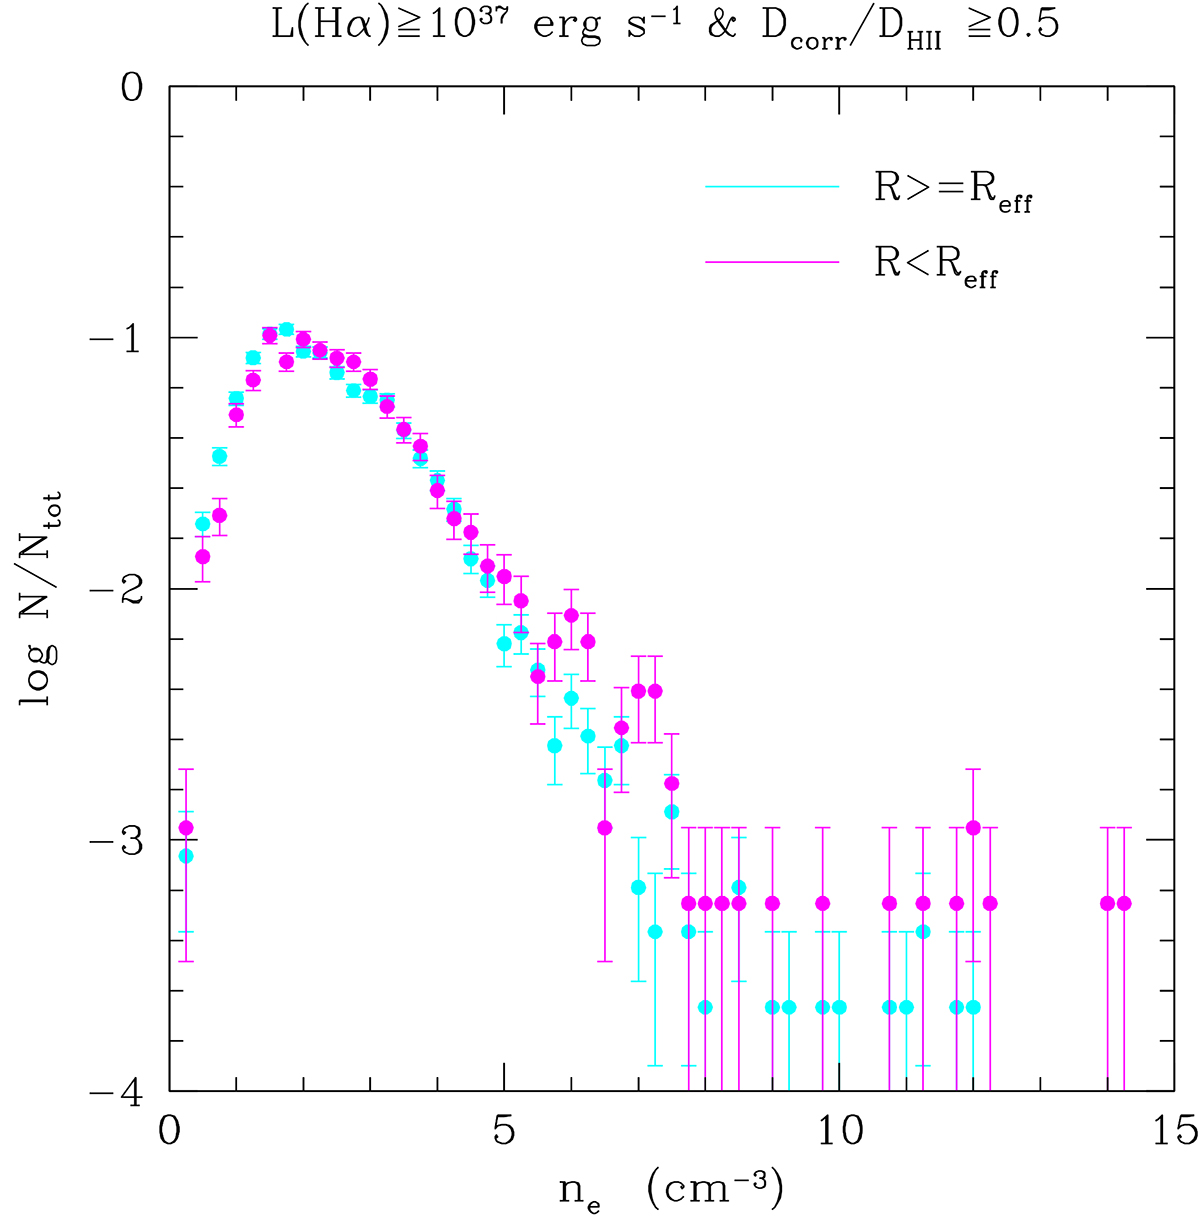
Normalised distributions of the electron density derived using equivalent diameters corrected for seeing effects for H II regions with L(Hα)≥1037 erg s−1 for H II regions located inside (magenta) and outside (cyan) the i-band effective radius. The two distributions are normalised to the total number of regions located within and outside the effective radius. The number of H II regions with densities ne ≥ 7.5 cm−3 for the two samples are most one per bin but are plotted at different positions because of the different normalisation.
Current usage metrics show cumulative count of Article Views (full-text article views including HTML views, PDF and ePub downloads, according to the available data) and Abstracts Views on Vision4Press platform.
Data correspond to usage on the plateform after 2015. The current usage metrics is available 48-96 hours after online publication and is updated daily on week days.
Initial download of the metrics may take a while.