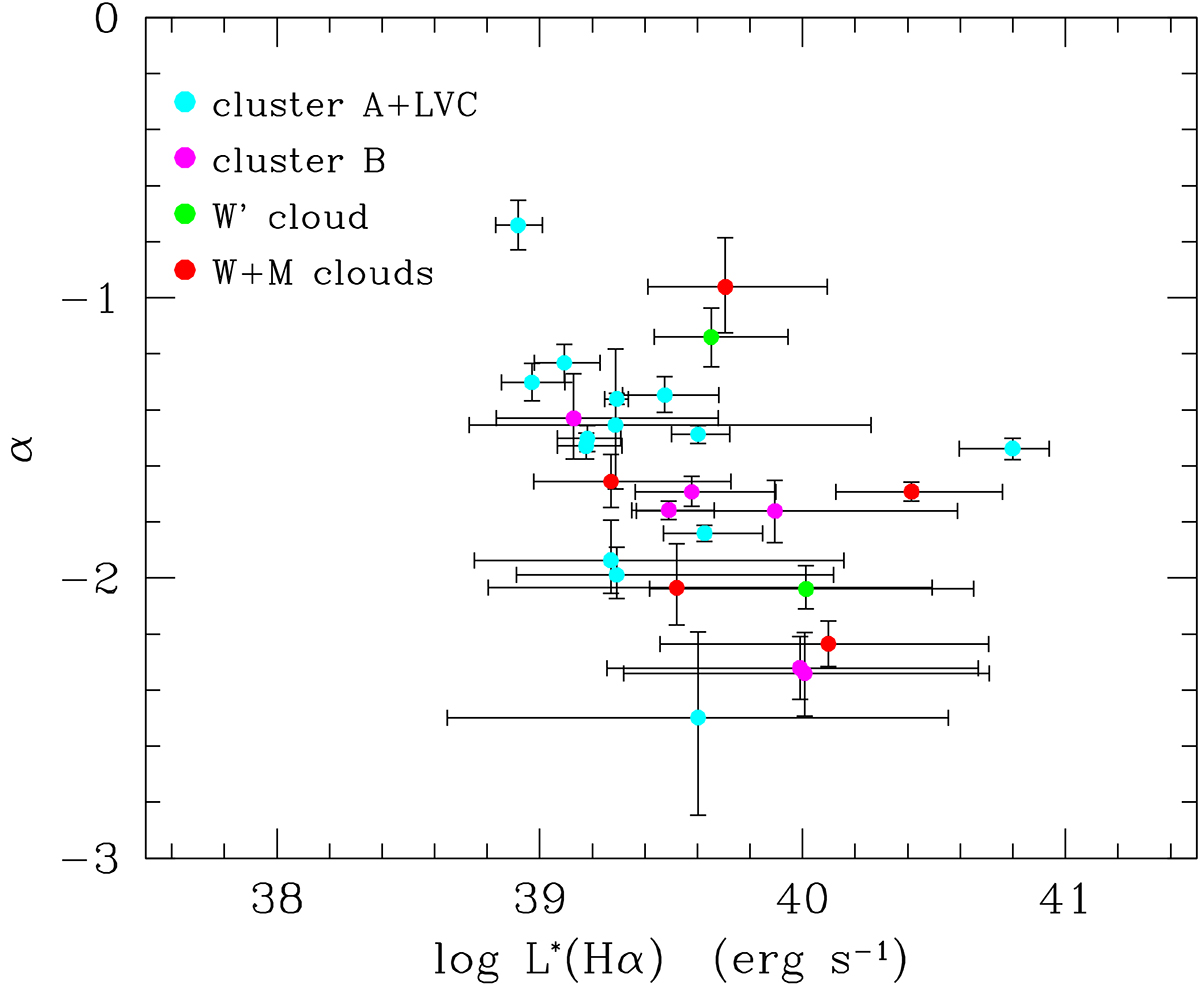
Fig. 10.
Download original image
Relation between the faint end slope α of the luminosity function and the characteristic luminosity of individual galaxies with more than 20 H II regions brighter than L(Hα)≥1037 erg s−1. Different colours are used for galaxies belonging to different cluster substructures: cyan for cluster A and LVC, 16.5 Mpc; magenta for cluster B, 15.8 Mpc; green for W′ cloud, 23 Mpc; and red for W and M clouds, 32 Mpc. The Hα luminosities of individual H II regions are corrected for dust attenuation and [N II] contamination as described in Sect. 3.2.
Current usage metrics show cumulative count of Article Views (full-text article views including HTML views, PDF and ePub downloads, according to the available data) and Abstracts Views on Vision4Press platform.
Data correspond to usage on the plateform after 2015. The current usage metrics is available 48-96 hours after online publication and is updated daily on week days.
Initial download of the metrics may take a while.