Fig. 7.
Download original image
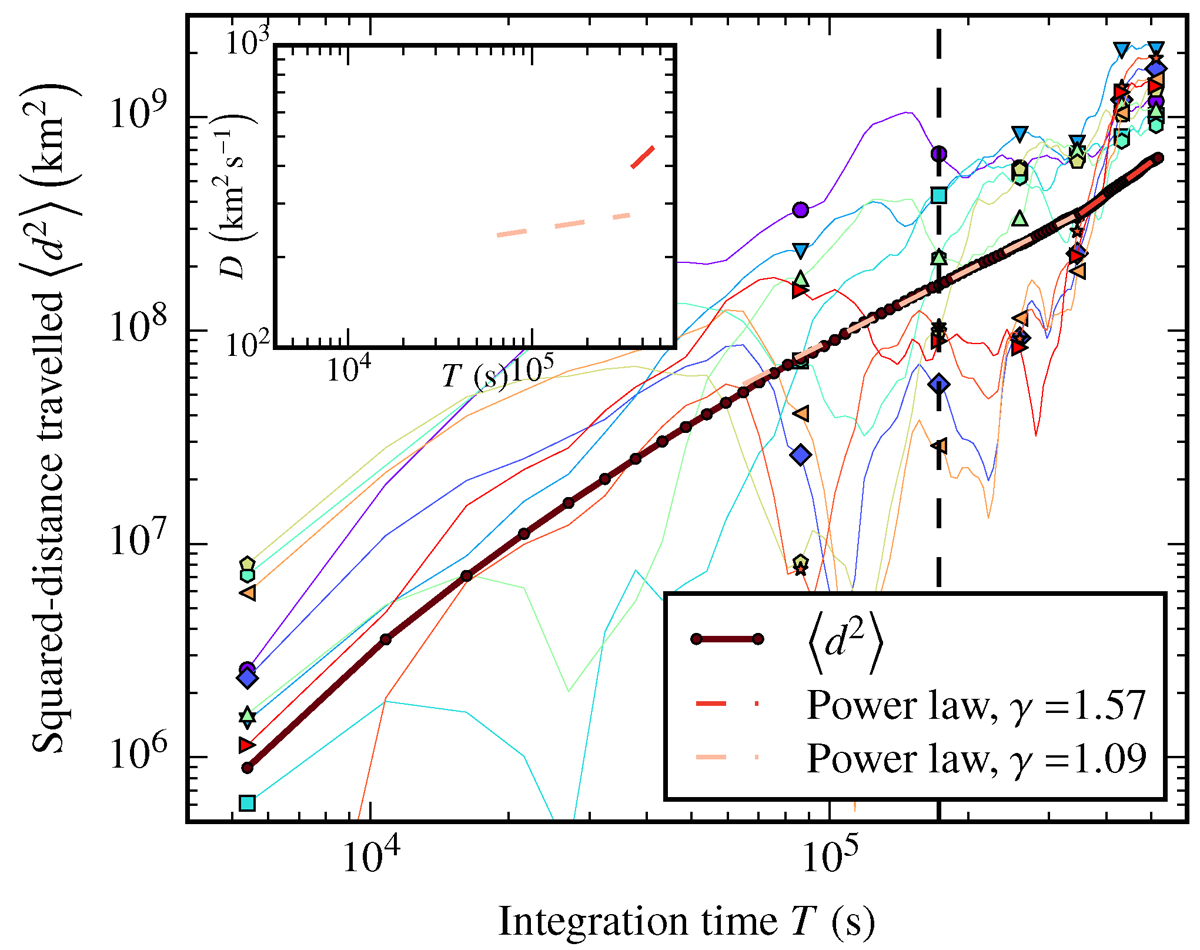
Ensemble-averaged ⟨d2⟩ of the quadratic distance travelled by tracers as a function of time (solid dark red line), power law fits (lighter red and cream lines), and (inset) corresponding diffusion coefficients as determined by Eq. (5). The thin coloured lines with markers every 24 h show the history of d2 for individual tracers with larger-than-average excursions on long times. The surface trajectories of these tracers are shown with the same markers and colours in Figs. 3 and 4.
Current usage metrics show cumulative count of Article Views (full-text article views including HTML views, PDF and ePub downloads, according to the available data) and Abstracts Views on Vision4Press platform.
Data correspond to usage on the plateform after 2015. The current usage metrics is available 48-96 hours after online publication and is updated daily on week days.
Initial download of the metrics may take a while.