Open Access
Fig. 6.
Download original image
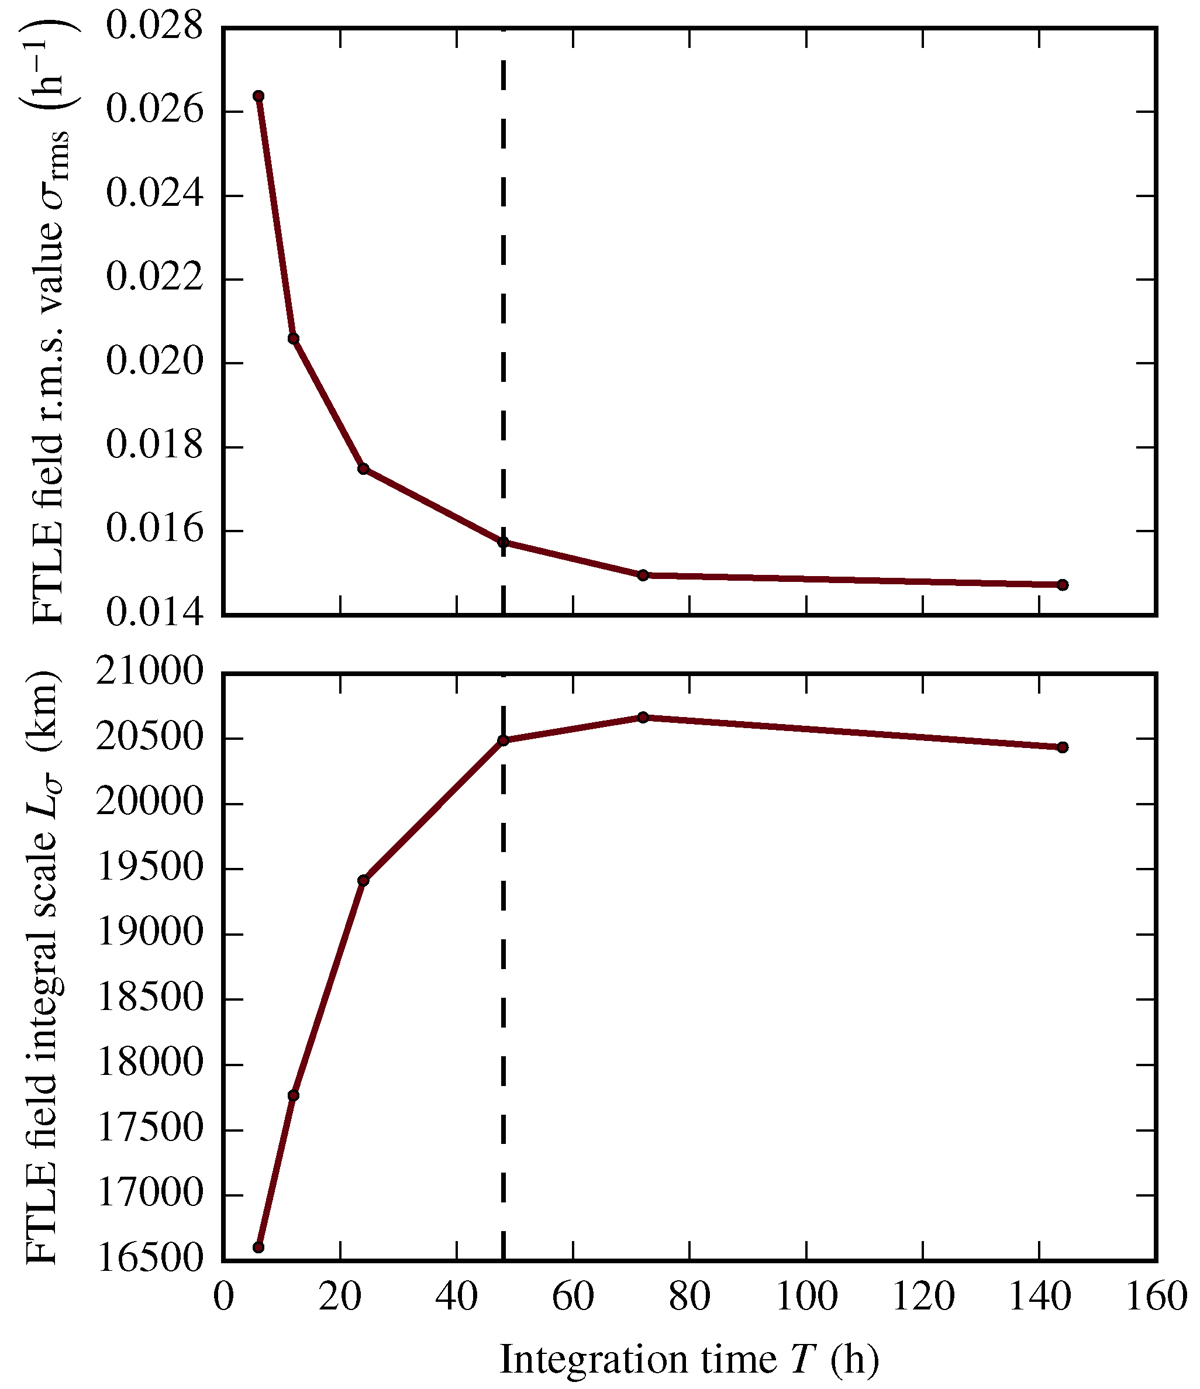
Change as a function of the FTLE target integration time of the r.m.s. value and integral scale of FTLE distributions, derived from spherical harmonics spectra using Eq. (2). The dashed vertical line shows τSG = 48 h, the typical correlation time of supergranulation.
Current usage metrics show cumulative count of Article Views (full-text article views including HTML views, PDF and ePub downloads, according to the available data) and Abstracts Views on Vision4Press platform.
Data correspond to usage on the plateform after 2015. The current usage metrics is available 48-96 hours after online publication and is updated daily on week days.
Initial download of the metrics may take a while.