Open Access
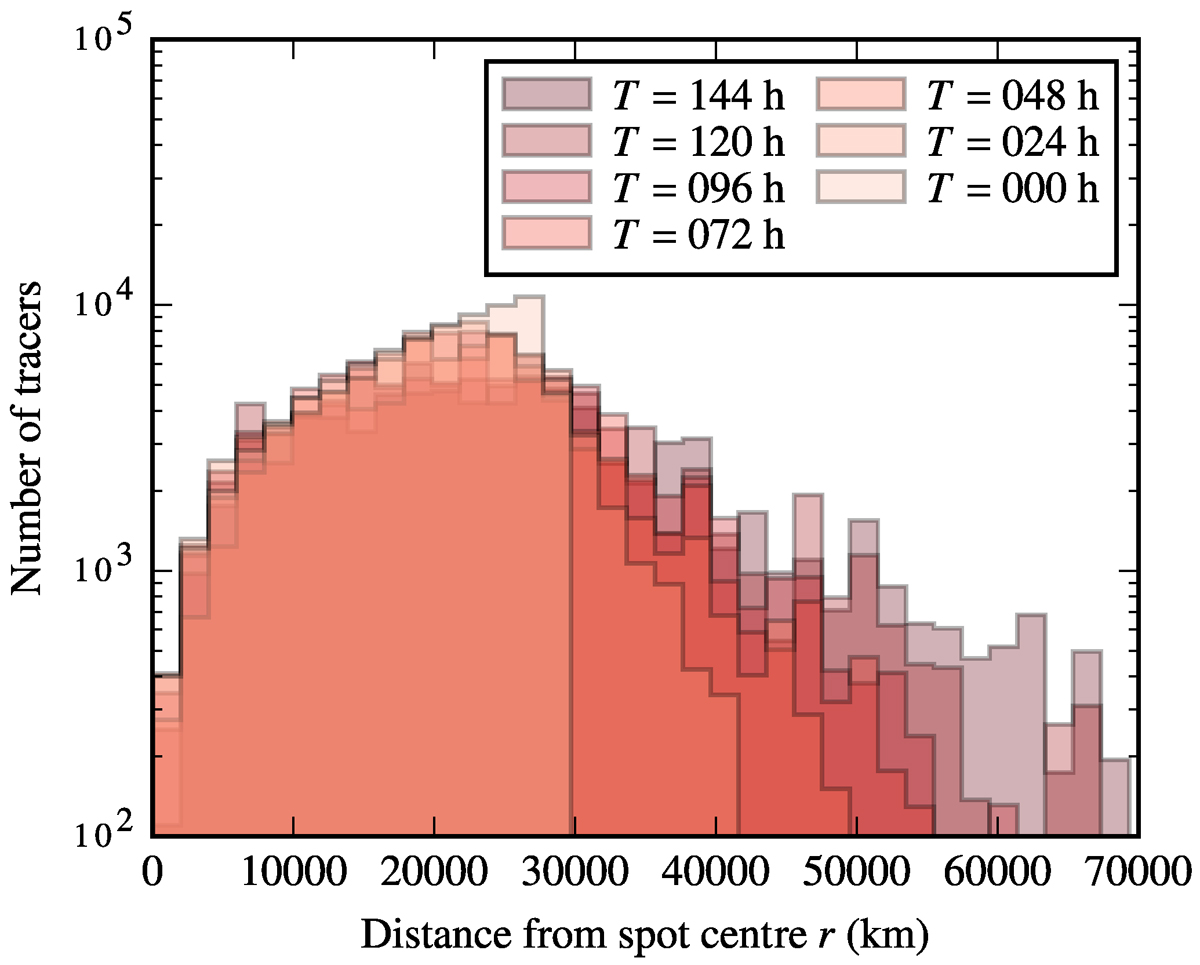
Fig. 10.
Download original image
Time evolution of the histogram distribution of distances travelled by tracers initially enclosed within circular spots of tracers of radius 30 000 km, with respect to their relative spot centres. Together with Fig. 9, the plot highlights the turbulent diffusive spread of tracers.
Current usage metrics show cumulative count of Article Views (full-text article views including HTML views, PDF and ePub downloads, according to the available data) and Abstracts Views on Vision4Press platform.
Data correspond to usage on the plateform after 2015. The current usage metrics is available 48-96 hours after online publication and is updated daily on week days.
Initial download of the metrics may take a while.