Open Access
Fig. 1.
Download original image
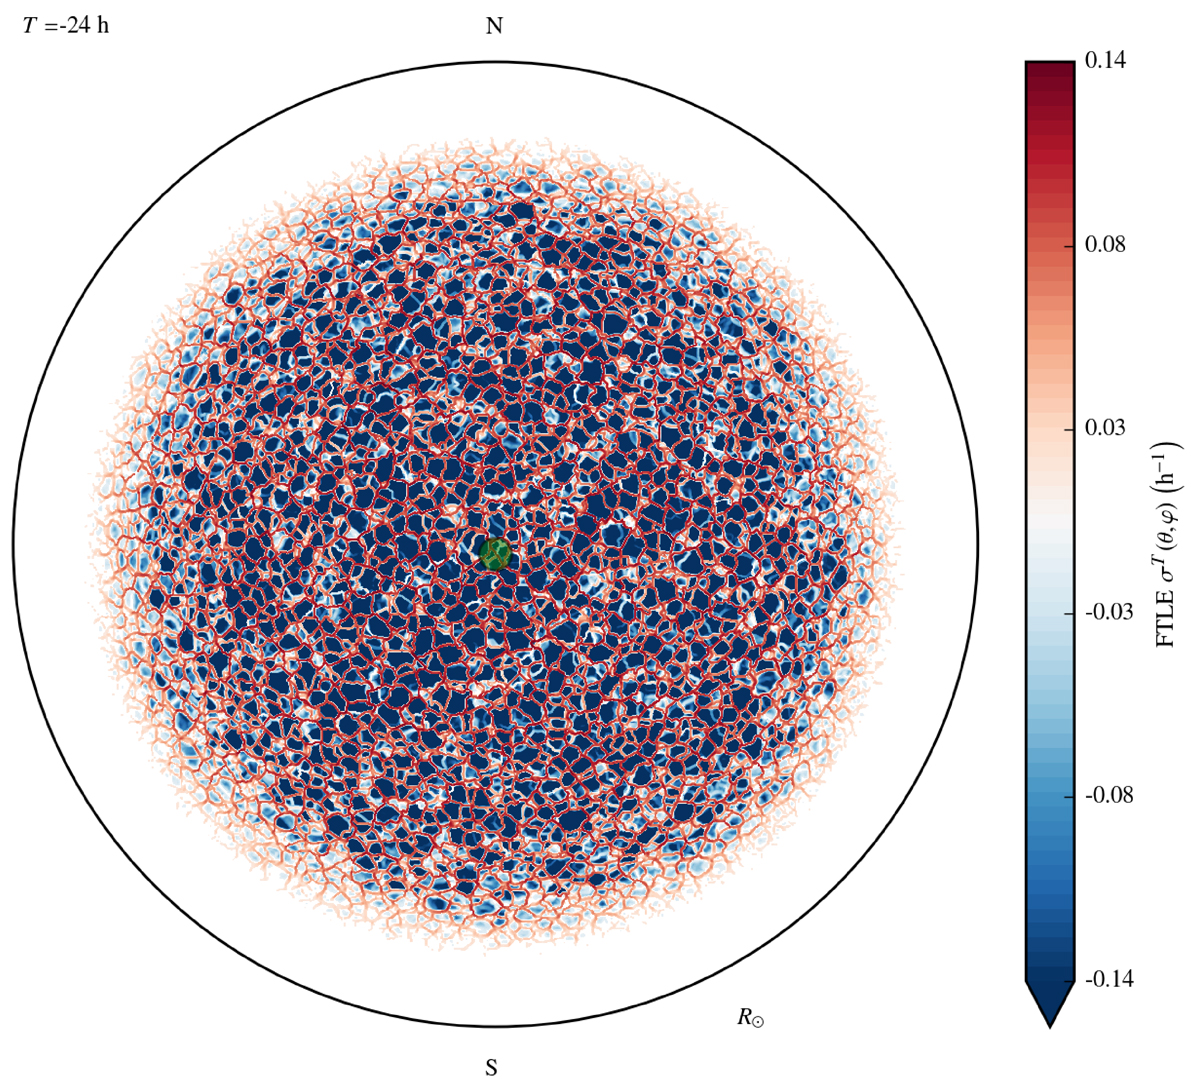
Global distribution of 24 h, backward-in-time FTLE of solar surface flows (in inverse hour units) computed using photospheric velocity field maps of 29 November 2018, up to 60° from the disc centre. The green circle corresponds to a typical 30 Mm supergranule diameter.
Current usage metrics show cumulative count of Article Views (full-text article views including HTML views, PDF and ePub downloads, according to the available data) and Abstracts Views on Vision4Press platform.
Data correspond to usage on the plateform after 2015. The current usage metrics is available 48-96 hours after online publication and is updated daily on week days.
Initial download of the metrics may take a while.