Fig. 5
Download original image
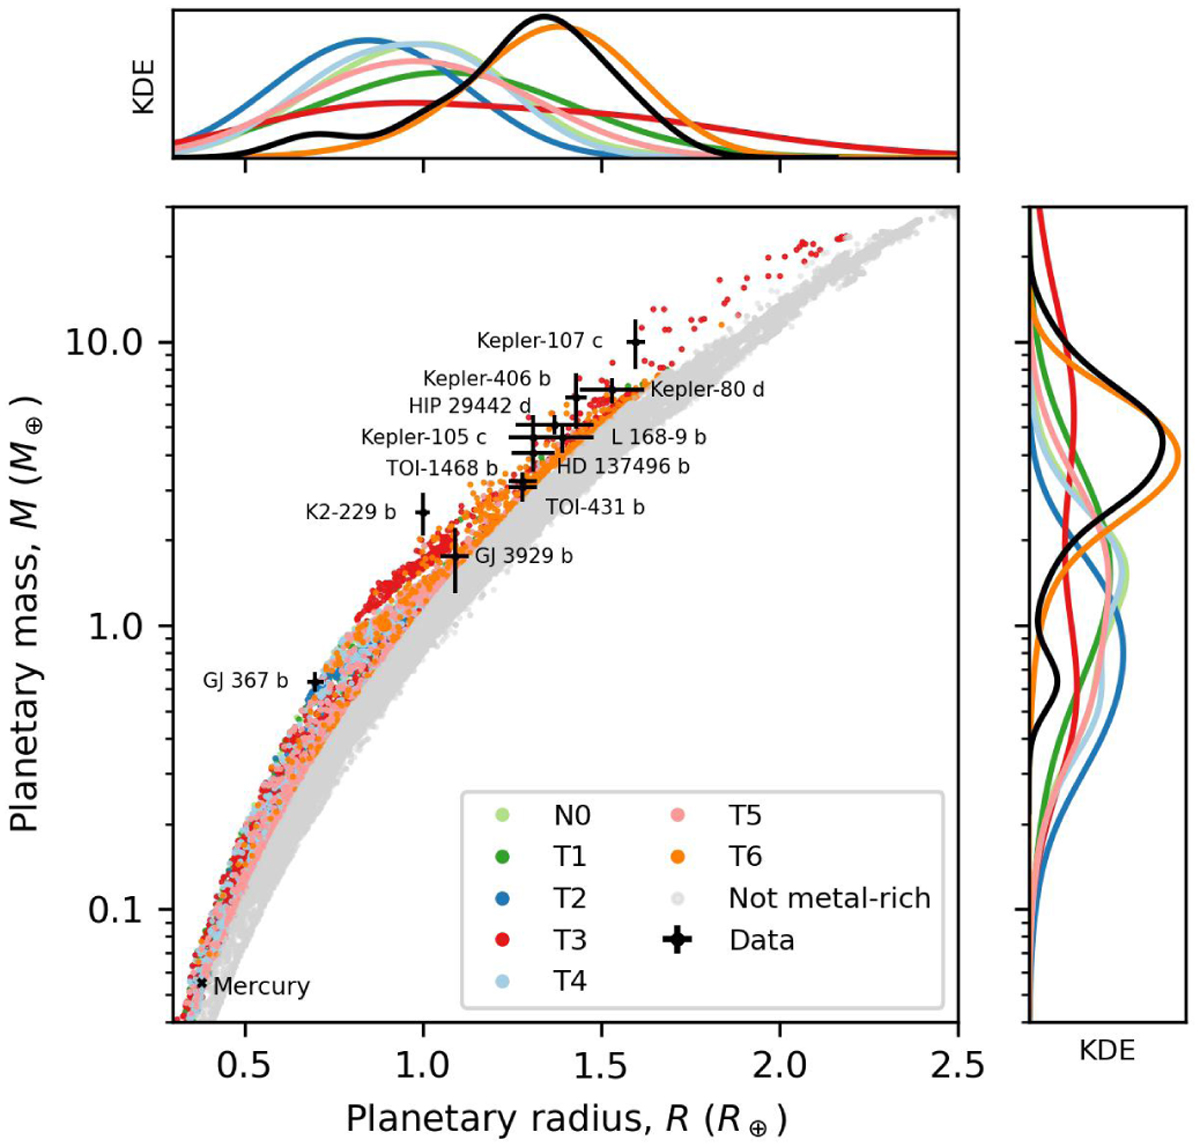
Results from our orbital instability model for different model assumptions. Mass, M, as a function of radius, R, of the simulated planets surviving an orbital instability for the different model assumptions described in Section 2.3.1. The final planets are deemed metal-rich remnants (colored symbols) and non-metal-rich remnants (gray symbols) based on the high-density threshold of Equation (3). The black data points correspond to the observed high-density exoplanets listed in Table 1, with one standard deviation uncertainty bars; planet Mercury is plotted for comparison. The side plots are the Kernel Density Estimates (KDEs) of the radius (top) and mass (left) of the observed high-density planets (black curve) and the simulated metal-rich giant-impact remnants (colored curves). The model KDEs are weighted according to the probability of detection of the simulated metal-rich worlds by transit surveys, to mimic observational bias typical of exoplanetary surveys (Section 2.4).
Current usage metrics show cumulative count of Article Views (full-text article views including HTML views, PDF and ePub downloads, according to the available data) and Abstracts Views on Vision4Press platform.
Data correspond to usage on the plateform after 2015. The current usage metrics is available 48-96 hours after online publication and is updated daily on week days.
Initial download of the metrics may take a while.