Fig. C.1
Download original image
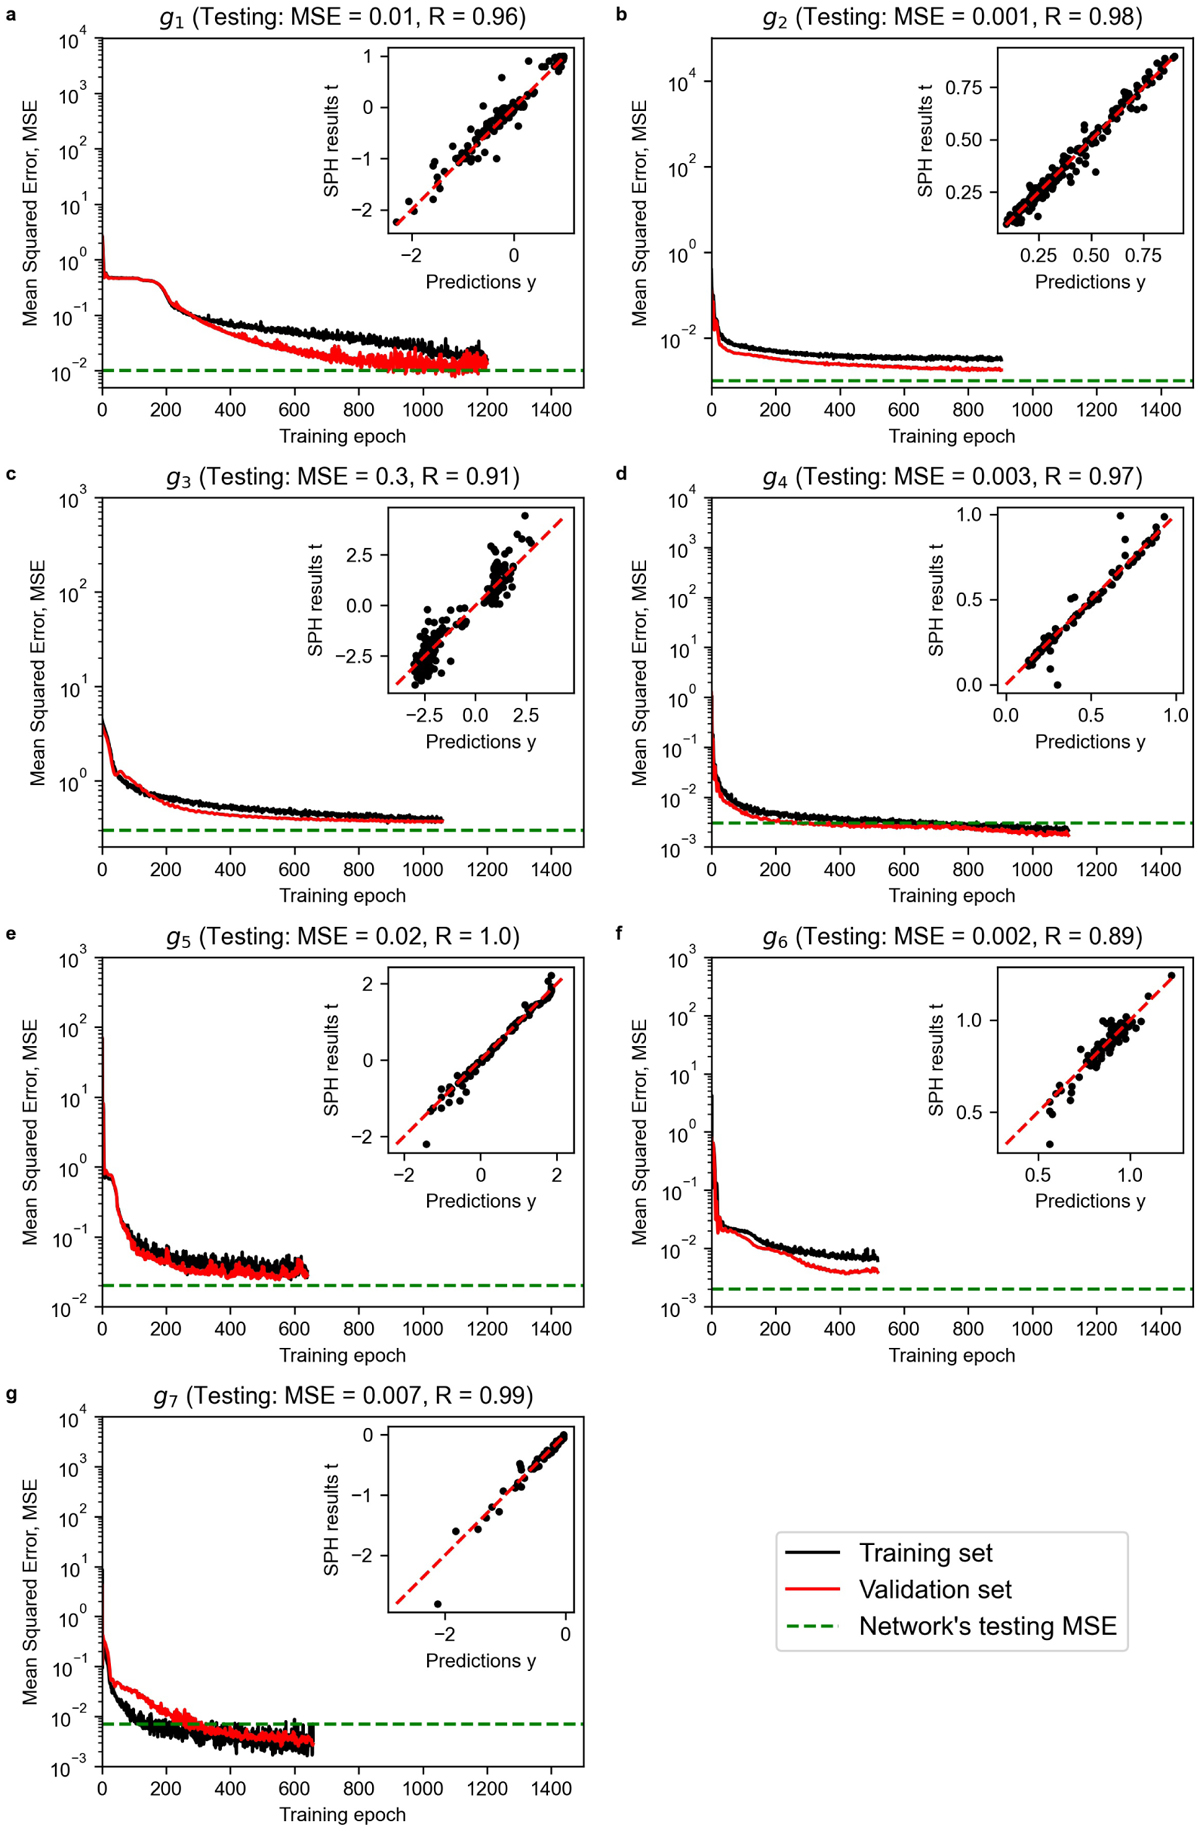
Training history and performance of the optimal neural networks composing the giant-impact model. Panels a–g: Mean squared error (MSE) between y(x) predicted by the neural networks gi(i = 1,...,7) and the corresponding SPH outcome, t(x), as a function of the training epochs. The inset plots show the correlation with index R between y(x) and t(x) for the testing set. The complete training report (including the suboptimal neural networks) is in the Dataset S2.
Current usage metrics show cumulative count of Article Views (full-text article views including HTML views, PDF and ePub downloads, according to the available data) and Abstracts Views on Vision4Press platform.
Data correspond to usage on the plateform after 2015. The current usage metrics is available 48-96 hours after online publication and is updated daily on week days.
Initial download of the metrics may take a while.