Open Access
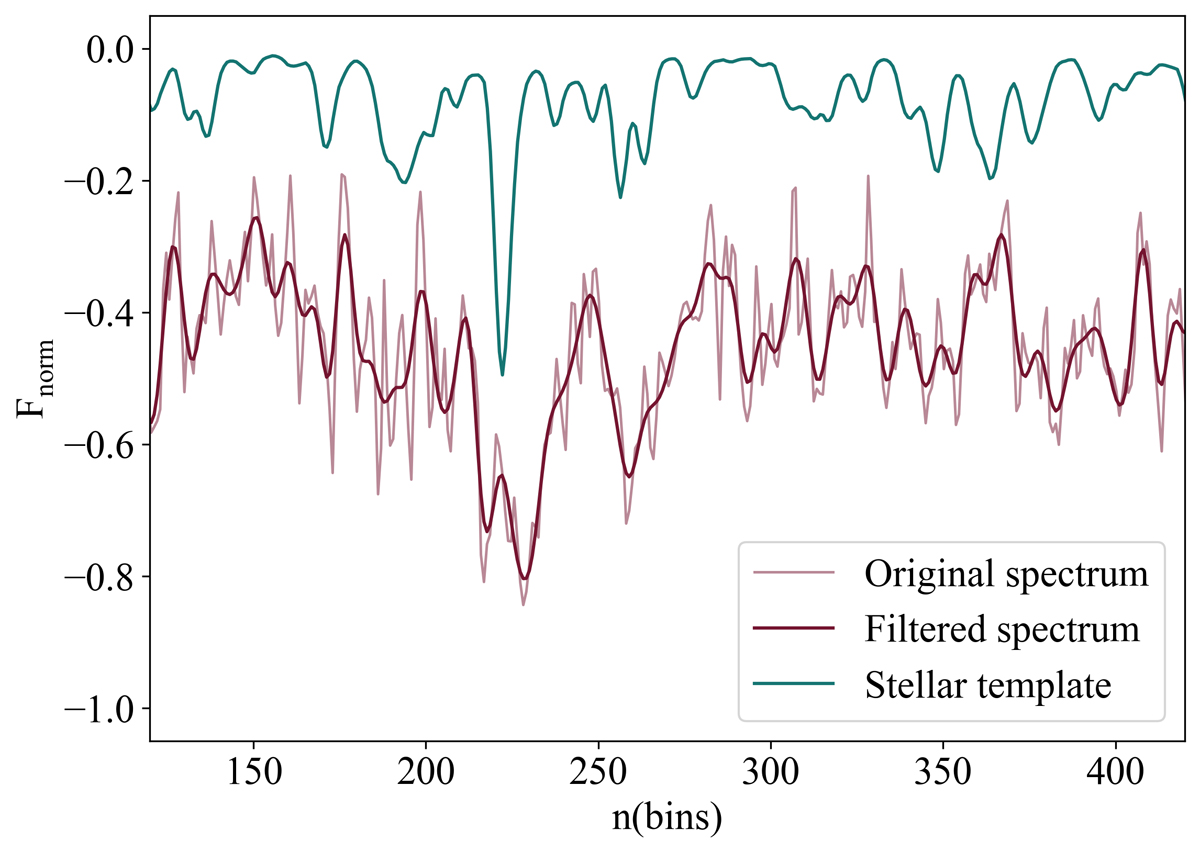
Fig. 6.
Download original image
Absorption line spectrum of R52 from the MEGARA/HR-I configuration, in logarithmic wavelength. The light and dark red lines show the spectrum before and after applying the pass-band filter for higher frequencies. The stellar template is also shown with a blue line.
Current usage metrics show cumulative count of Article Views (full-text article views including HTML views, PDF and ePub downloads, according to the available data) and Abstracts Views on Vision4Press platform.
Data correspond to usage on the plateform after 2015. The current usage metrics is available 48-96 hours after online publication and is updated daily on week days.
Initial download of the metrics may take a while.