Open Access
Fig. 13.
Download original image
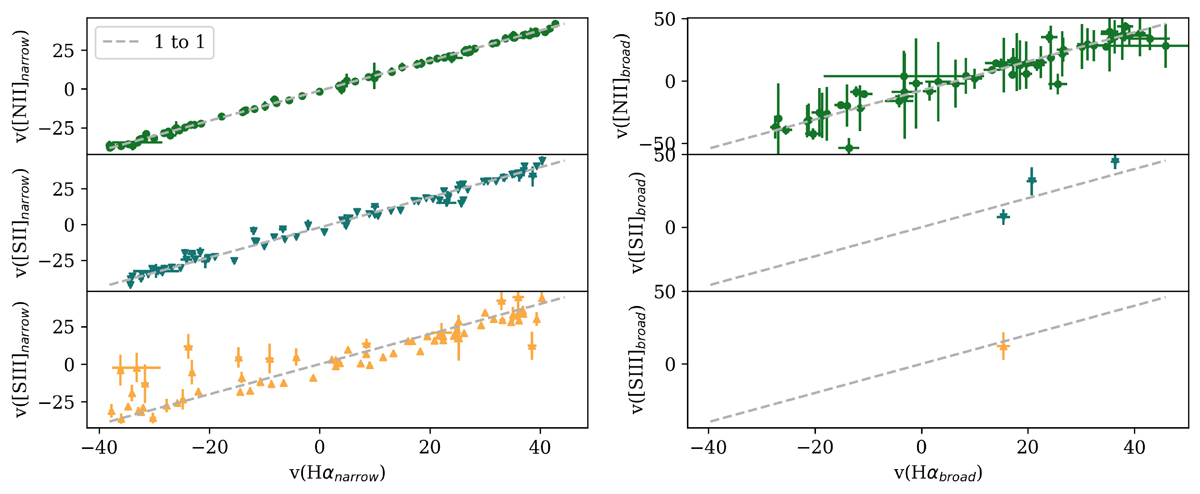
Comparison of the radial velocity of the different measured components of the [NII], [SII], and [SIII] lines in each region (top to bottom panels) with those of the narrow and broad Hα components (left to right panels). All velocities are shown in km/s.
Current usage metrics show cumulative count of Article Views (full-text article views including HTML views, PDF and ePub downloads, according to the available data) and Abstracts Views on Vision4Press platform.
Data correspond to usage on the plateform after 2015. The current usage metrics is available 48-96 hours after online publication and is updated daily on week days.
Initial download of the metrics may take a while.