Fig. 6
Download original image
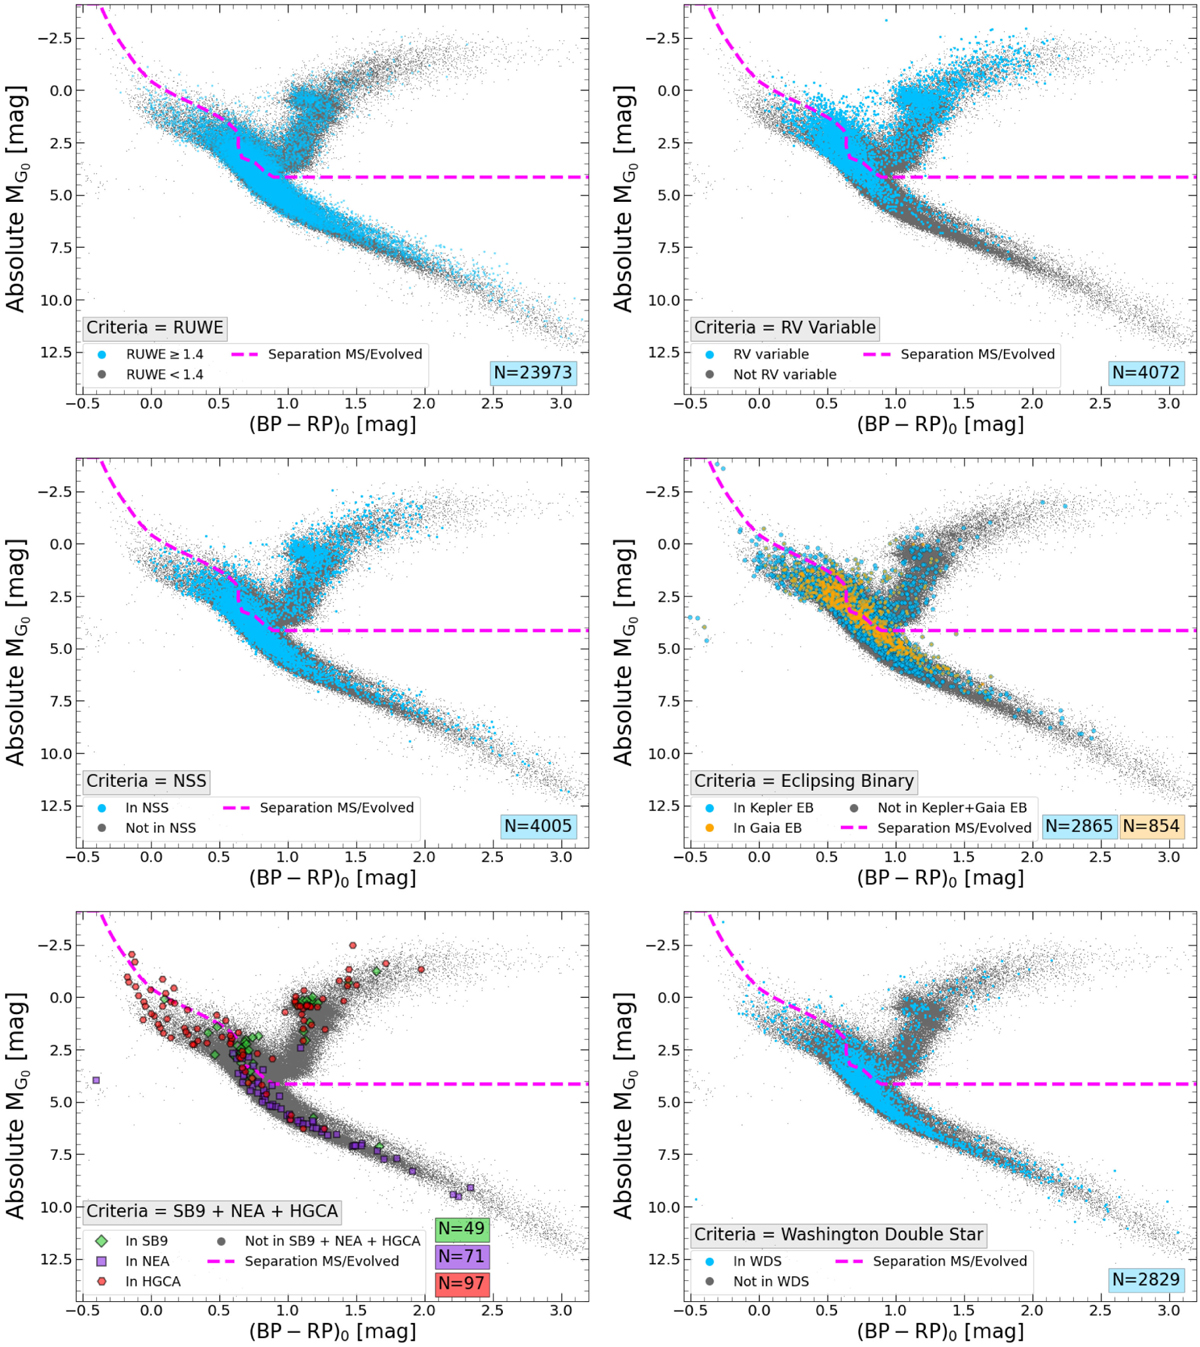
Characterization of the binary categories defined in Sect. 4. The panels display the CMD projection of the RUWE, RV Variable, NSS, Kepler + Gaia EB, SB9 + NEA + HGCA, and WDS binary samples, respectively. In all the CMDs, we show the separation between MS and evolved stars as guidance (dashed fuchsia line). The number of systems in each category is summarized in the bottom-right corner. The CMD projections help to illustrate the selection effects of each category (see Sect. 4 for details).
Current usage metrics show cumulative count of Article Views (full-text article views including HTML views, PDF and ePub downloads, according to the available data) and Abstracts Views on Vision4Press platform.
Data correspond to usage on the plateform after 2015. The current usage metrics is available 48-96 hours after online publication and is updated daily on week days.
Initial download of the metrics may take a while.