Fig. 3
Download original image
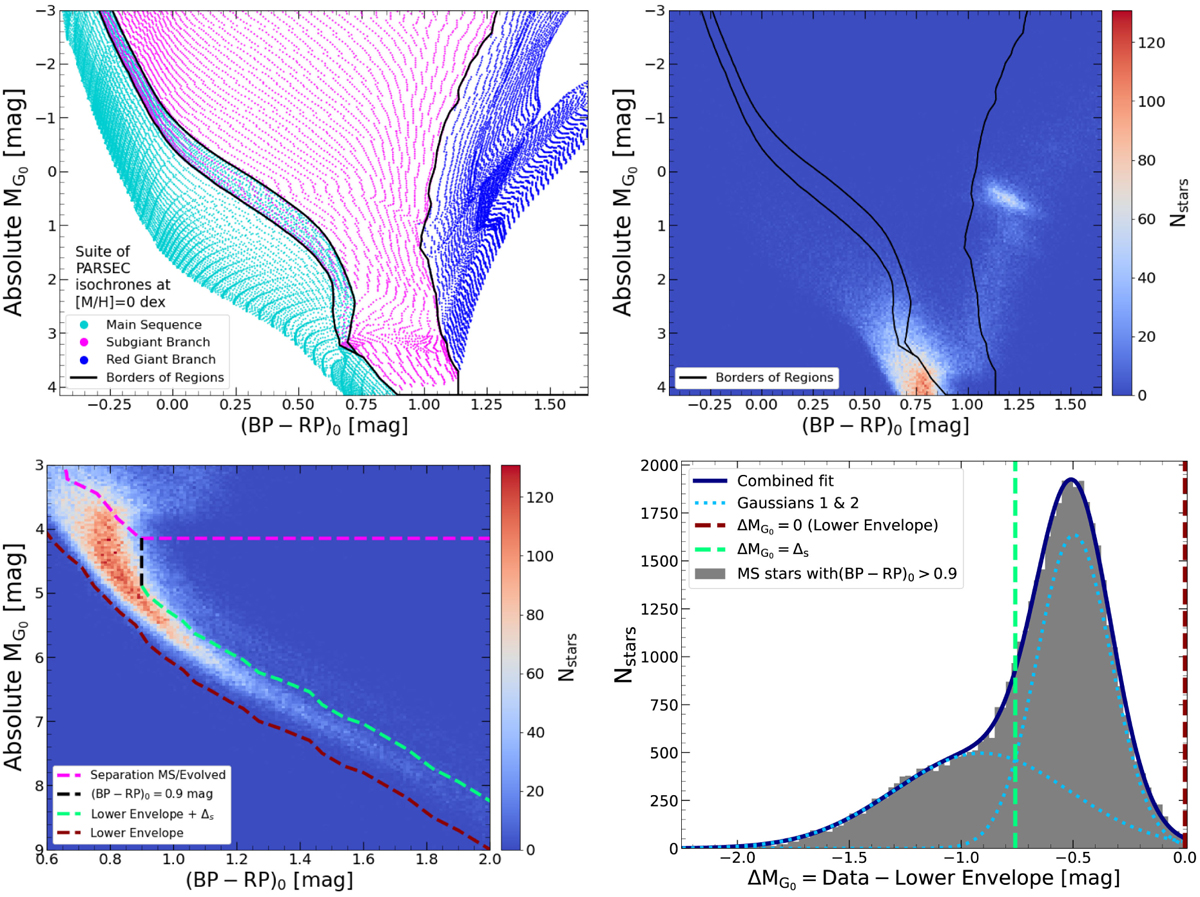
Characterization of the CMD regions presented in Sect. 3. The top-left panel shows the suite of PARSEC models we used to define the upper-CMD regions, and the projections of these onto the Hess diagram are displayed in the top-right panel. The bottom-left panel shows the Hess diagram and borders of the lower-CMD regions. The bottom-right panel shows the distribution of ΔMG0 values we used to define the Photometric Binary region.
Current usage metrics show cumulative count of Article Views (full-text article views including HTML views, PDF and ePub downloads, according to the available data) and Abstracts Views on Vision4Press platform.
Data correspond to usage on the plateform after 2015. The current usage metrics is available 48-96 hours after online publication and is updated daily on week days.
Initial download of the metrics may take a while.