Fig. 2
Download original image
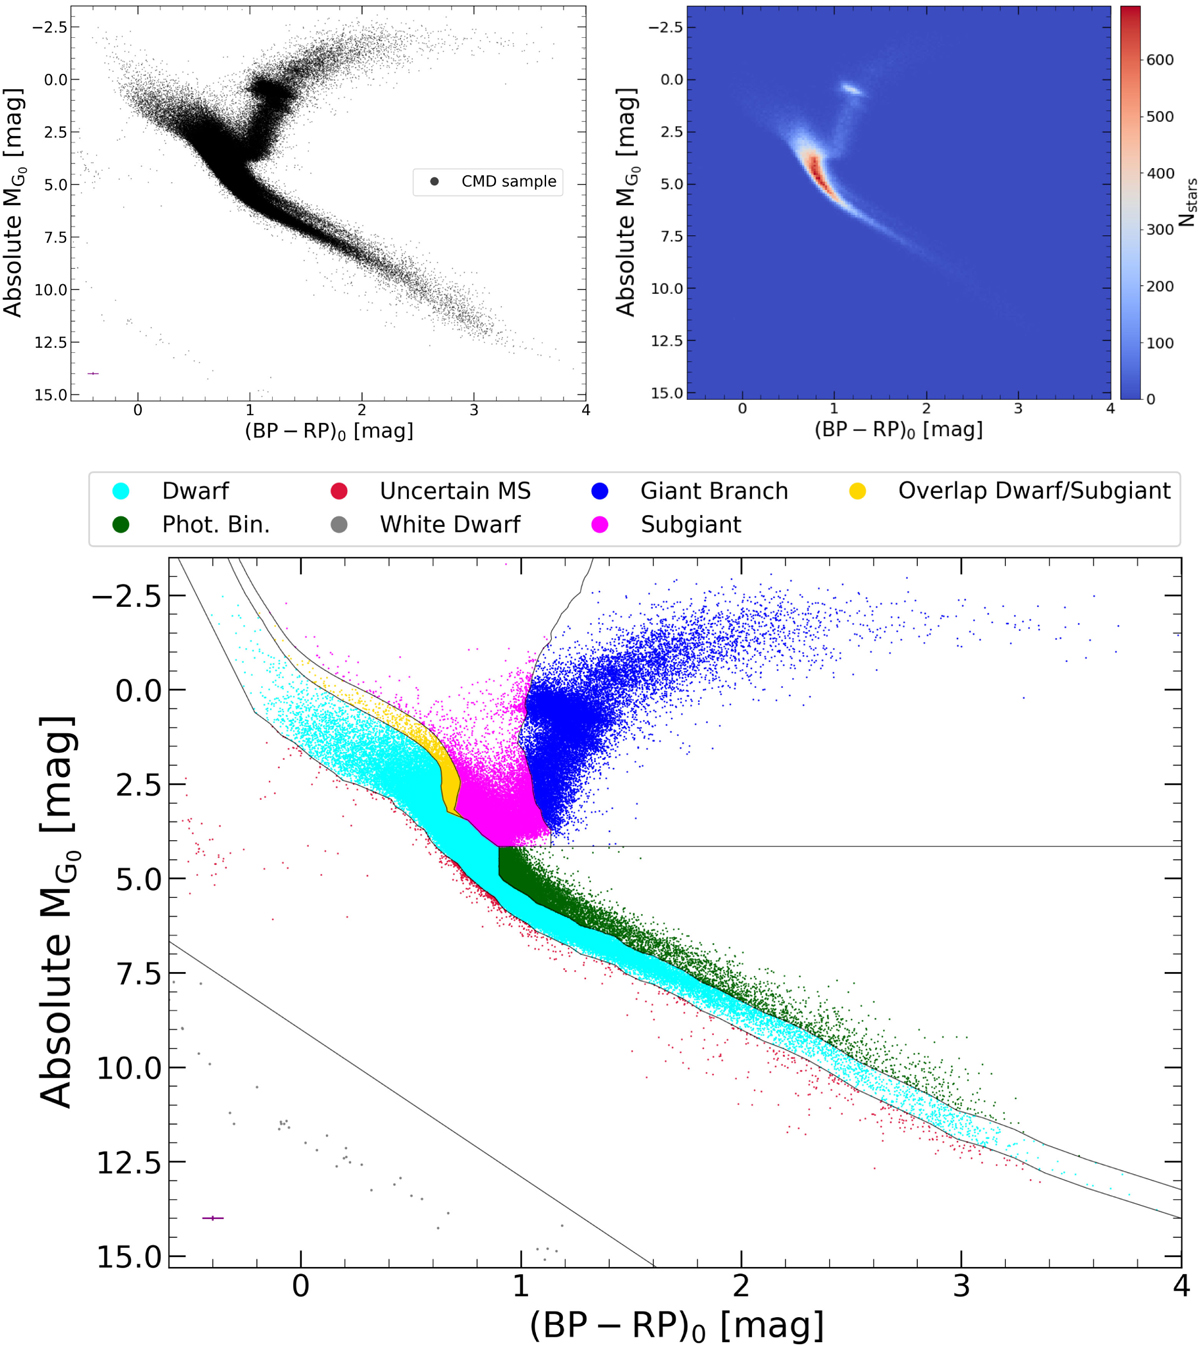
Absolute and de-reddened Gaia CMD of the Kepler targets. Top-left: CMD sample described in Sect. 3. The purple marker illustrates the median error bars. Top-right: Hess diagram of the CMD sample. Bottom: CMD sample, with the stars color-coded according to the CMD categories we define in Sect. 3. The black lines illustrate the borders of the CMD regions.
Current usage metrics show cumulative count of Article Views (full-text article views including HTML views, PDF and ePub downloads, according to the available data) and Abstracts Views on Vision4Press platform.
Data correspond to usage on the plateform after 2015. The current usage metrics is available 48-96 hours after online publication and is updated daily on week days.
Initial download of the metrics may take a while.