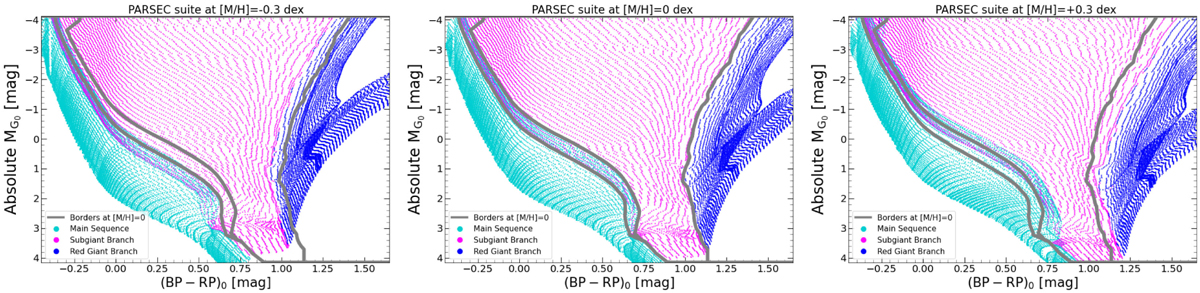
Fig. G.1
Download original image
Illustration of the metallicity-dependence of the evolved CMD regions, analogous to the top-left panel of Figure 3. From left to right, the panels show suites of PARSEC models at [M/H]=−0.3, 0, and +0.3 dex. The colors indicate the evolutionary stage for each metallicity bin. The borders used in the CMD classification of Sect. 3, calculated at [M/H]=0 dex, are shown as the thick grey lines in all panels.
Current usage metrics show cumulative count of Article Views (full-text article views including HTML views, PDF and ePub downloads, according to the available data) and Abstracts Views on Vision4Press platform.
Data correspond to usage on the plateform after 2015. The current usage metrics is available 48-96 hours after online publication and is updated daily on week days.
Initial download of the metrics may take a while.