Fig. 5
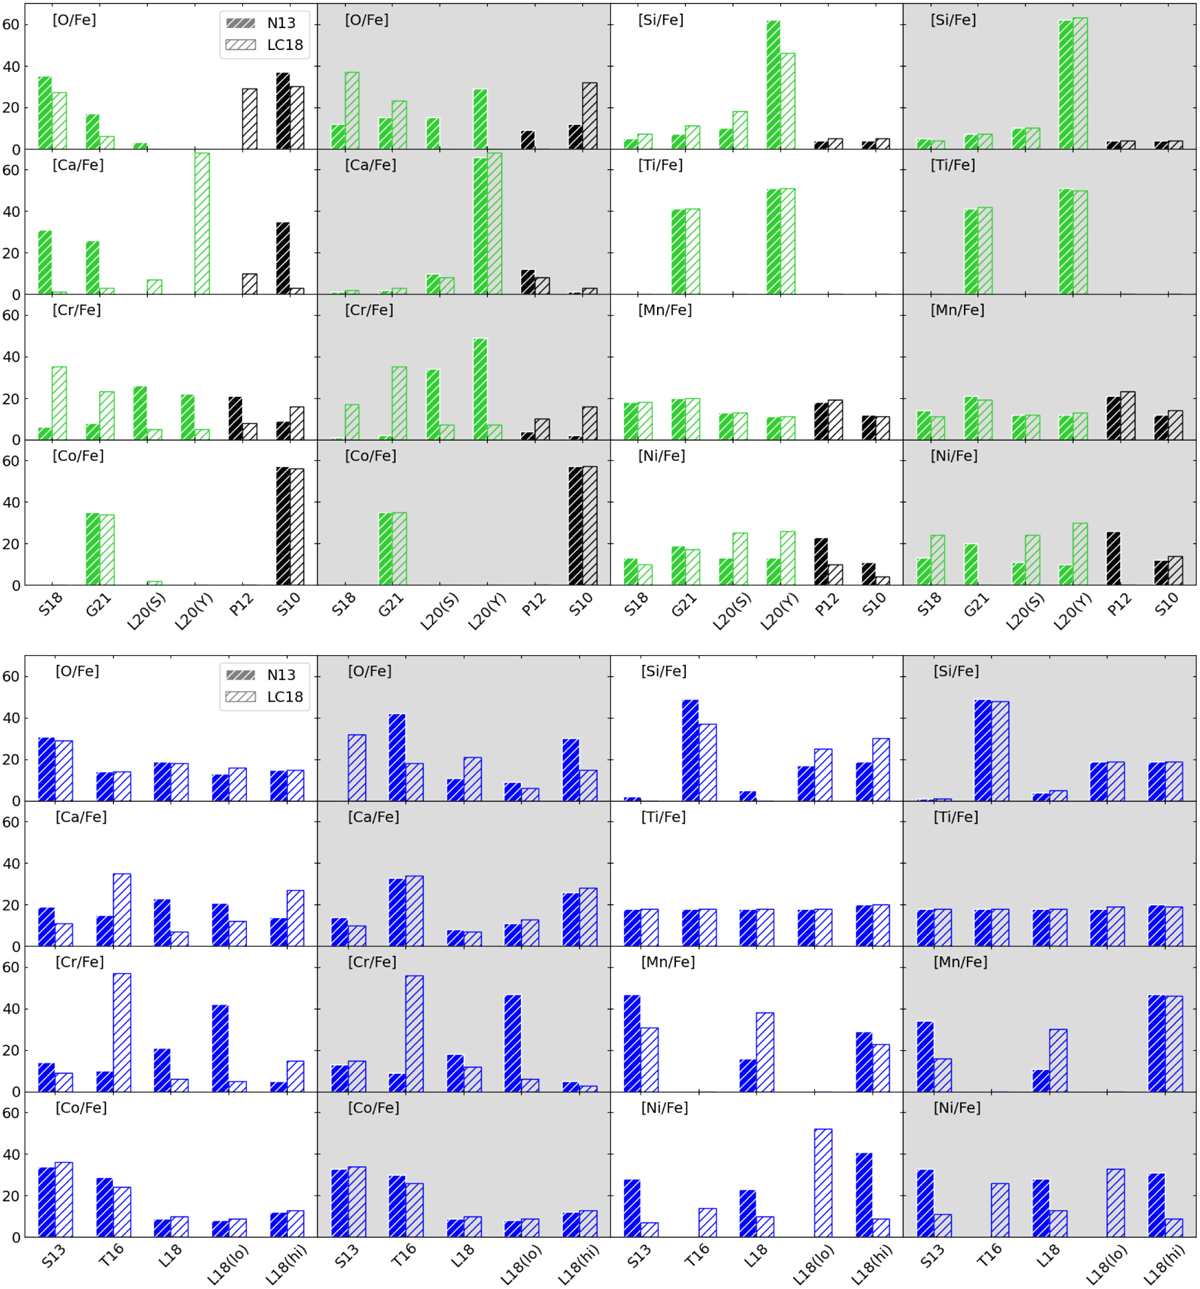
Download original image
Counts of sub-MCh (top panel) and near-MCh (bottom panel) SN Ia yields that are used by N13 and LC18 GCE models with a χ2 score in the 84th percentile. The bar colours indicate the explosion mechanism, as in Figures 2 and 3. Shaded and unshaded panels are for calculations using NLTE and LTE observational datasets, respectively.
Current usage metrics show cumulative count of Article Views (full-text article views including HTML views, PDF and ePub downloads, according to the available data) and Abstracts Views on Vision4Press platform.
Data correspond to usage on the plateform after 2015. The current usage metrics is available 48-96 hours after online publication and is updated daily on week days.
Initial download of the metrics may take a while.