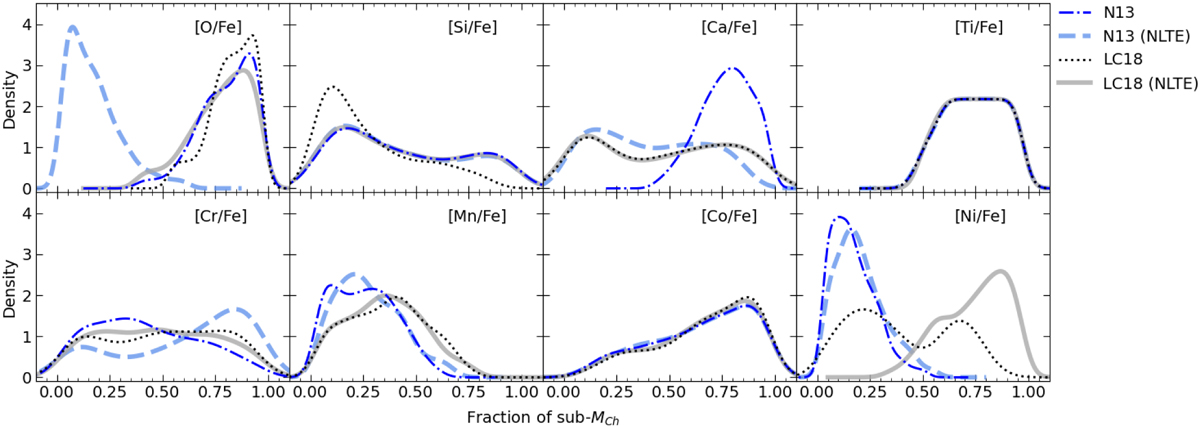
Fig. 4
Download original image
Probability density function of GCE models with a χ2 score in the 84th percentile, as a function of the fractional contribution from sub-MCh SNe Ia in those GCE models (see text for details). The thin dashed blue and dotted black lines include only LTE observational data for each of the GCE models with N13 and LC18 massive star yields, respectively. The thick solid blue and grey lines are calculated using only NLTE data. The results should be interpreted in the context that, for some elements, the absence of well-fitting GCE models may compromise the reliability of the observed patterns.
Current usage metrics show cumulative count of Article Views (full-text article views including HTML views, PDF and ePub downloads, according to the available data) and Abstracts Views on Vision4Press platform.
Data correspond to usage on the plateform after 2015. The current usage metrics is available 48-96 hours after online publication and is updated daily on week days.
Initial download of the metrics may take a while.