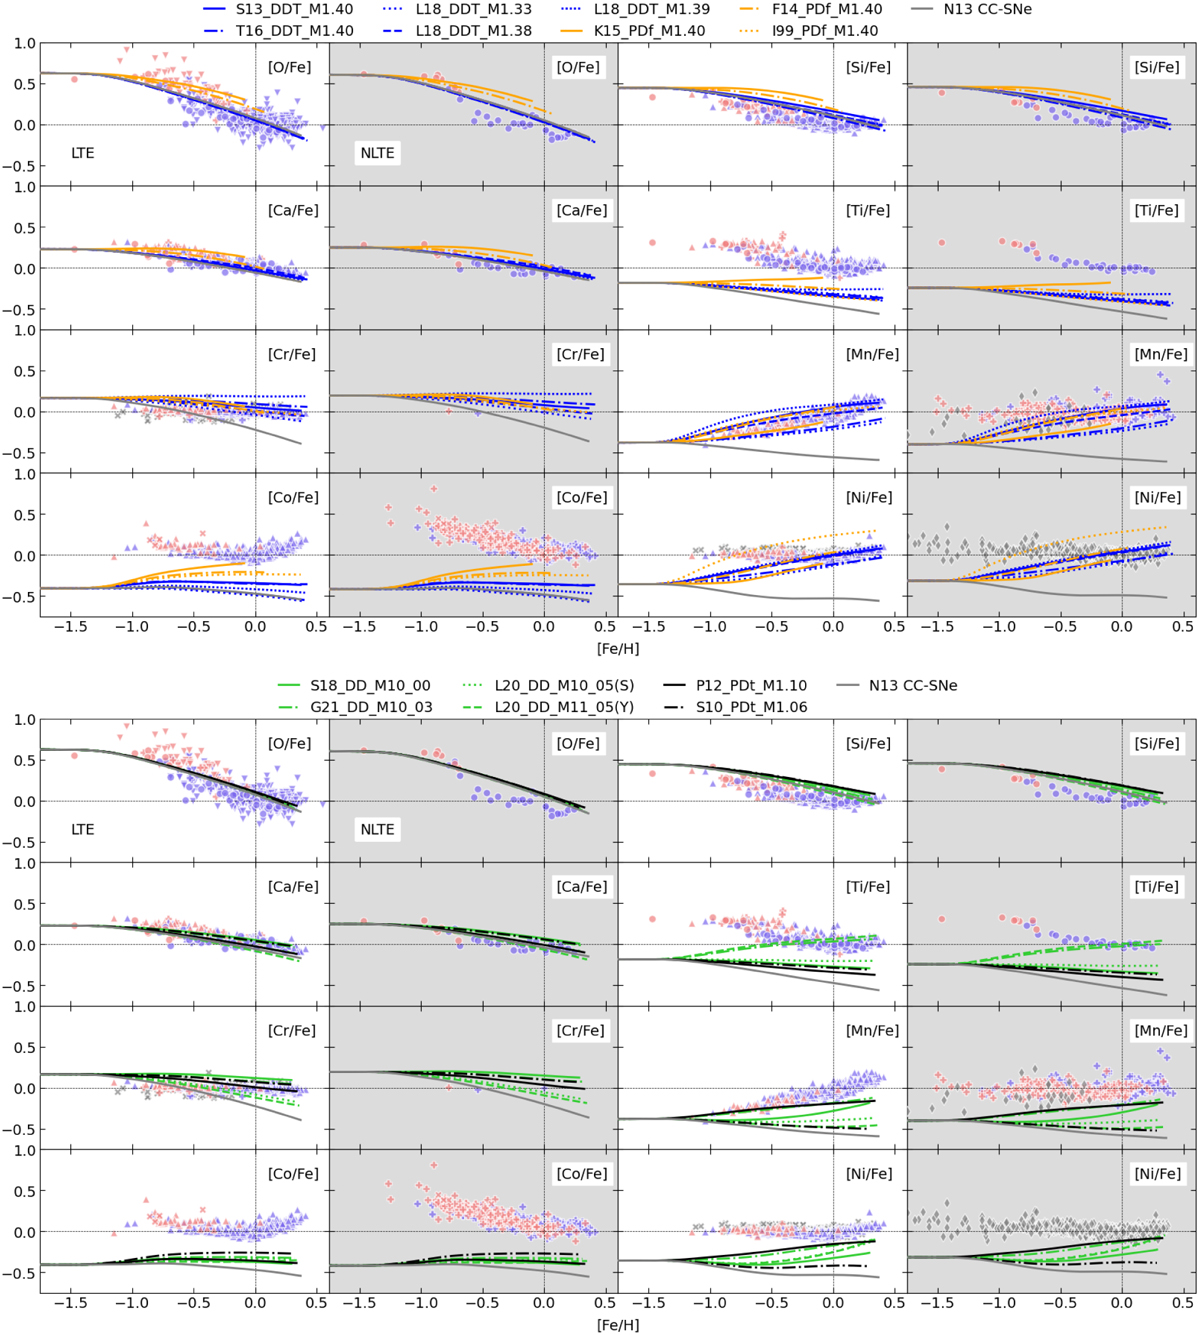
Fig. 2
Download original image
Predicted evolution of [X/Fe] versus [Fe/H] in the Milky Way’s disk for O, Ca, Si, and the Fe-peak elements for the GCE models with N13 CCSN yields. The top and bottom panels show predictions with near- and sub-MCh SN Ia yields, respectively. For each element, LTE (panels without shading) and NLTE (shaded) observational data are plotted separately. The GCE tracks are colour coded according to the explosion mechanism (see text), where the grey line shows the evolution of [X/Fe] with no contribution from SNe Ia (i.e. assuming only a contribution to X from CCSNe). See Table 1 for the list of observational datasets used.
Current usage metrics show cumulative count of Article Views (full-text article views including HTML views, PDF and ePub downloads, according to the available data) and Abstracts Views on Vision4Press platform.
Data correspond to usage on the plateform after 2015. The current usage metrics is available 48-96 hours after online publication and is updated daily on week days.
Initial download of the metrics may take a while.