Fig. A.5
Download original image
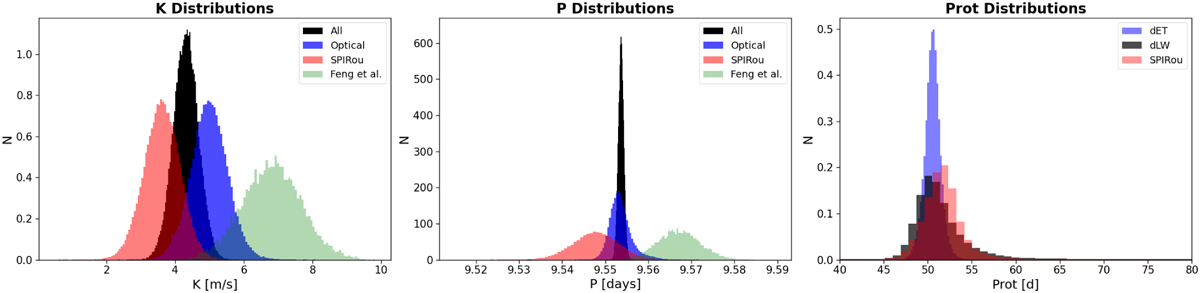
Posterior distributions of the key parameters derived from the MCMC analysis for GL 480. The left panel shows the posterior distribution of the semi-amplitude K for the combined dataset (black), optical data (blue), SPIRou data (red), and the reference distribution from Feng et al. (2020). The middle panel presents the posterior distributions of the orbital period P, using the same color scheme. The right panel displays the posterior distributions of the stellar rotation period Prot derived from the dET (blue) and dLW (black) time series, and the SPIRou dataset (red). All histograms are normalized to unit area for comparison.
Current usage metrics show cumulative count of Article Views (full-text article views including HTML views, PDF and ePub downloads, according to the available data) and Abstracts Views on Vision4Press platform.
Data correspond to usage on the plateform after 2015. The current usage metrics is available 48-96 hours after online publication and is updated daily on week days.
Initial download of the metrics may take a while.